Log in



How Do You Find and Vet Instagram Influencers in Brazil? A Stage-by-Stage Guide


What is in this article
- Stage 1 — Decide whether your Brazil campaign belongs on Instagram or TikTok
- Stage 2 — Rebuild the engagement floor using Brazil's own numbers
- Stage 3 — Adjust the floor for the category you are actually buying
- Stage 4 — Read the Brazil follower ranking as a reach index, not a shortlist
- Stage 5 — Verify the audience behind each rate before it enters the shortlist
- Stage 6 — Ship the shortlist with its limits stated, so the numbers survive review
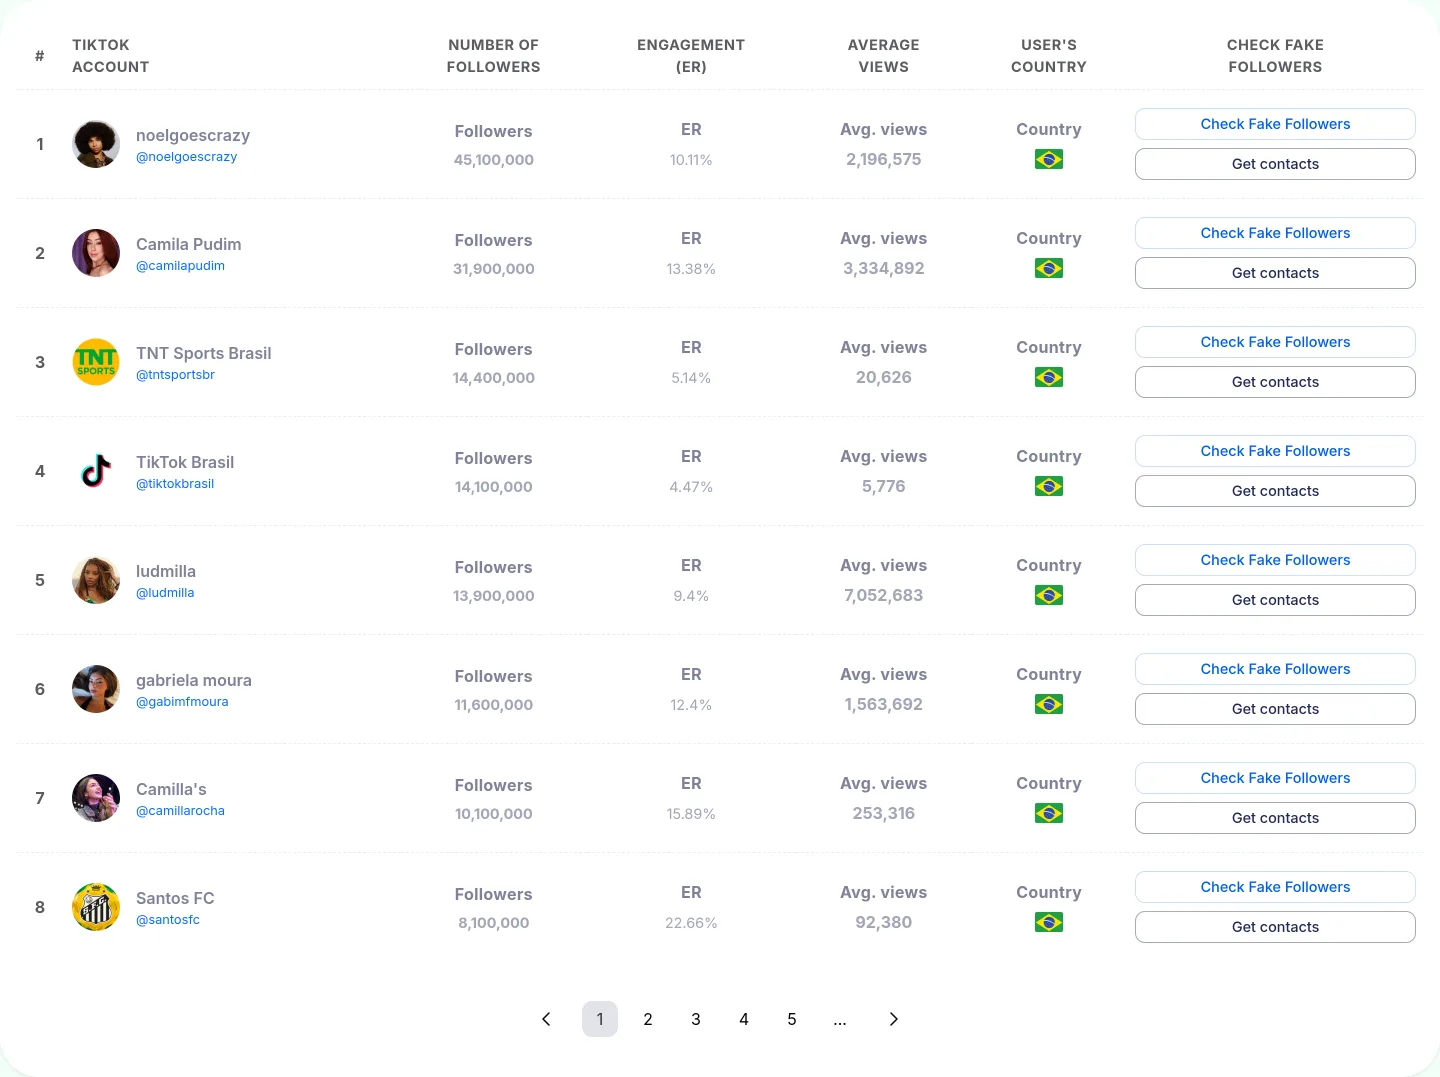
Brazil's 50 largest Instagram accounts median 0.29% engagement. That is 11th of the 14 countries in our sample and below the 0.51% overall Instagram median across 700 accounts — so any pass mark you imported from another market will reject almost the entire Brazilian top tier before you have looked at a single piece of creative. Meanwhile Brazil's largest TikTok accounts median 8.98%. Same country, same audience, roughly a 31x difference in the headline number.
That is the real decision structure for a Brazil campaign, and it has an order. Platform first, then the country floor, then the category floor, then the ranking, then the audience behind the rate. Here is each stage with the numbers it depends on.
Stage 1 — Decide whether your Brazil campaign belongs on Instagram or TikTok
Put the two Brazilian medians side by side before you brief anything. Across the 50 Instagram accounts with the most followers in Brazil as of 15 September 2026, median engagement is 0.29%. Across the 50 largest TikTok accounts reaching Brazil, median engagement is 8.98%. That is the single largest lever available to you in this market — larger than creator selection, larger than category, larger than anything you will recover by negotiating harder.
Read Brazil's position relative to other markets rather than its absolute number, because absolute engagement percentages are not comparable across platforms. On Instagram, Brazil sits 11th of 14 countries, between the United States at 0.39% and France at 0.23%. On TikTok, Brazil sits 9th of 14 at 8.98%, behind Mexico at 13.94% and Spain at 11.46% but close to the 9.05% overall TikTok median. Mid-pack on TikTok, near the bottom on Instagram. If your brief is platform-agnostic, that asymmetry should decide it.
Why is engagement so much higher on TikTok in Brazil?
Part of the gap is real and part of it is how the samples were drawn, and you need to be able to say which is which when a client asks. Every one of the 700 sampled Instagram accounts sits in the 1M+ follower tier — 100% of the sample. On TikTok, 63.1% of the 637 sampled accounts are 1M+, and that tier medians 10.45% against 6.79% for the 100K–1M tier. So the TikTok figure is partly a mixed-size sample where the biggest accounts happen to engage hardest, while the Instagram figure is purely the very top of the market. The gap is still directionally enormous, but treat 31x as an indicative ratio between two differently drawn samples, not a physical constant.
TikTok in Brazil also gives you a screen Instagram does not. The sample median for views per follower is 17.41%, alongside median average views of 327,058. That lets you separate an account that reaches beyond its follower base from one that only farms its own audience — there is no Instagram equivalent in this data. If you are weighing the platform seriously, the Brazil TikTok follower ranking is where to compare those view-based figures against the engagement rates.
Exit this stage with a written platform decision in the brief. If it is Instagram, write down alongside it that Brazilian engagement percentages will look small by design, so nobody re-litigates it in week three.
Stage 2 — Rebuild the engagement floor using Brazil's own numbers
Once the platform is fixed, the pass mark has to be rebuilt from Brazilian data. The anchor is 0.29% — the median for Brazil's 50 largest Instagram accounts — against 0.51% for the full 700-account, 14-country Instagram sample. Brazil runs at roughly 57% of the overall median. Every threshold you set should be derived from 0.29%, not from a number someone remembers from a different campaign.
The cost of borrowing is easy to quantify. Argentina's 50 largest accounts median 1.72%, the highest of the 14 countries. An Argentina-calibrated floor of, say, 1.5% would clear almost nothing in Brazil's top tier: in the quoted Brazilian top 10, only @virginia at 3.92% survives it. Run the same threshold across the full 50 and you have built a search that returns an empty list and a planner who concludes there are no viable creators in Brazil. The country-by-country engagement benchmarks for Instagram and TikTok exist precisely so you can check the local baseline before setting the number.
Is 0.29% a bad engagement rate for a Brazilian influencer?
No — 0.29% is the middle of that tier, which means half of Brazil's 50 largest Instagram accounts sit below it. Against the 0.51% overall median it is low, and against Argentina's 1.72% it is very low, but "below the global median" is not the same as "underperforming for the market you are buying." The important caveat is the sample: these are the accounts with the most followers in Brazil, all of them above 1M, as of 15 September 2026. Smaller Brazilian creators are not in this data and will read differently. Use 0.29% as the reference point for the mega-tier, not as a universal verdict on Brazilian Instagram.
Note too that the 10 accounts quoted from the Brazil ranking median 0.47%. That is a small-sample reading of the very top of the list, not a second benchmark. Plan against the 50-account figure of 0.29%.
Exit this stage with one country-level pass mark expressed as a multiple: for example, candidates must clear 1.5x the Brazil median, i.e. roughly 0.44%. Expressed that way, the floor rebases itself when the median moves instead of quietly going stale.
Stage 3 — Adjust the floor for the category you are actually buying
Category resets the pass mark more sharply than country does. Across the full Instagram sample, medians run from 0.23% in Fashion and 0.33% in both Fashion Trends and Shopping & Fashion Travel, up through Entertainment at 0.75%, Football & Soccer at 0.89%, Rugby at 1% and Sports at 1.04%. That is a 4.5x spread between Fashion and Sports — wider than the gap between Brazil and the overall Instagram median.
Brazil's own top 10 spans exactly those unlike categories. The quoted list contains football accounts, singers, actors, entertainment profiles and fashion profiles. Apply one blanket floor across it and you are comparing a fashion creator against a sports benchmark, which either buys you the wrong creators or rejects the right ones. The reasoning behind converting medians into thresholds is set out in our guide to what engagement rate you should actually require from influencers.
How do I set a different engagement floor for fashion versus football creators in Brazil?
Take the category median as the base and express the floor as a multiple of it. At 1.5x, a two-or-three-category brief looks like this:
| Category | Sample median ER | Floor at 1.5x median |
|---|---|---|
| Fashion (97 accounts) | 0.23% | 0.35% |
| Fashion Trends (132 accounts) | 0.33% | 0.50% |
| Shopping & Fashion Travel (109 accounts) | 0.33% | 0.50% |
| Entertainment (191 accounts) | 0.75% | 1.13% |
| Football & Soccer (157 accounts) | 0.89% | 1.34% |
| Sports (113 accounts) | 1.04% | 1.56% |
One complication: profiles carry multiple categories. @cristiano is tagged Football & Soccer, Handball, Sports, Volleyball, Basketball and Rugby at once, so it will match benchmarks from 0.89% to 1.04% simultaneously. Pick the category that matches the campaign deliverable, not the most flattering one. A football-shirt launch is judged against 0.89%; a general sports-lifestyle post against 1.04%.
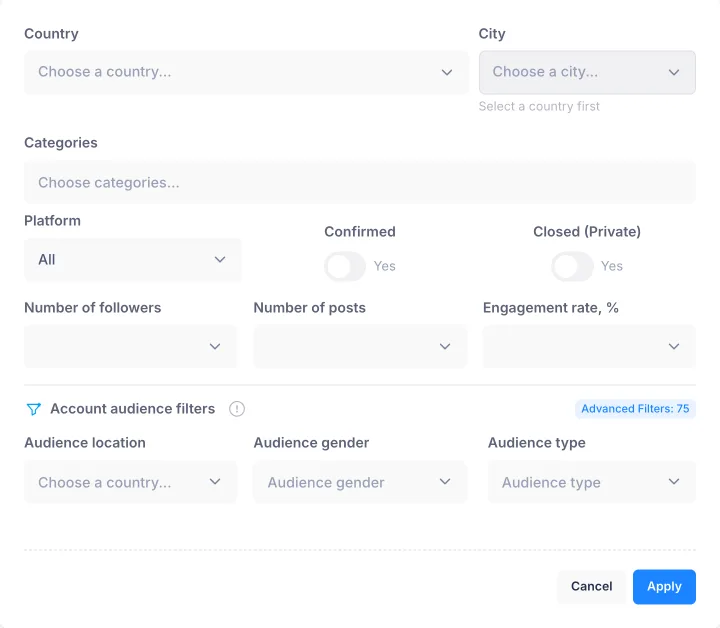
Then encode the result in the query rather than in a spreadsheet someone else cannot see. Setting country, category and minimum engagement together in infloo's influencer search filters means the pass mark travels with the search and every colleague running it gets the same shortlist.
Stage 4 — Read the Brazil follower ranking as a reach index, not a shortlist
The Brazil Instagram follower ranking is 50 accounts sorted by follower count reaching Brazil. It is a reach index. It is not a roster of Brazilian creators, and it is not a shortlist.
Who is the most-followed Instagram account in Brazil?
As of 15 September 2026 the top entry is @cristiano — Cristiano Ronaldo — with 642,618,405 followers and 1.06% engagement, categorised under Football & Soccer, Handball, Sports, Volleyball, Basketball and Rugby. That is a globally followed account that ranks in Brazil on reach. Its presence at #1 is the clearest possible argument for reading this list as a reach index: the largest account "in Brazil" is not a Brazilian creator proposition at all.
Should I pick the biggest Brazilian accounts first and filter later?
No, because follower rank predicts nothing about engagement inside this top 10. Rank #7, @virginia, engages at 3.92% with 52.8M followers. Rank #9, @gusttavolima, engages at 0.11% with 45.6M followers. That is a 35x spread between adjacent ranks. Around them: #2 @ronaldinho at 0.27%, #3 @marcelotwelve at 0.22%, #6 @larissamanoela at 1.19%. Sorting by followers deliberately puts some of the weakest-engaging accounts at the top of your list and hides the strongest at #7.
So sort by the Stage 3 floor instead. Against a Football & Soccer floor of 1.34%, neither @ronaldinho (0.27%) nor @marcelotwelve (0.22%) clears, while @cristiano at 1.06% falls short too. Against a Fashion Trends floor of 0.50%, @larissamanoela at 1.19% clears and @maisa at 0.33% does not. The surviving names bear almost no relation to the follower order.
Also kill the totals trap before someone puts it in a deck. The combined follower count across the 50 accounts is 1,158,513,813 — and that is not unique reach. These audiences overlap heavily, and overlapping follower counts cannot be added into an audience figure.
Exit this stage with a candidate pool in which every entry already clears its own category floor, before you spend anything on profile-level checks.
Stage 5 — Verify the audience behind each rate before it enters the shortlist
Engagement rate is calculated over follower count. That makes the follower base the denominator, and a suspect denominator turns the percentage into arithmetic rather than evidence. An account can clear a 1.34% floor because its engagement is genuinely strong, or because its follower count is smaller in practice than it looks. Those two cases require opposite decisions and look identical in a ranking table.
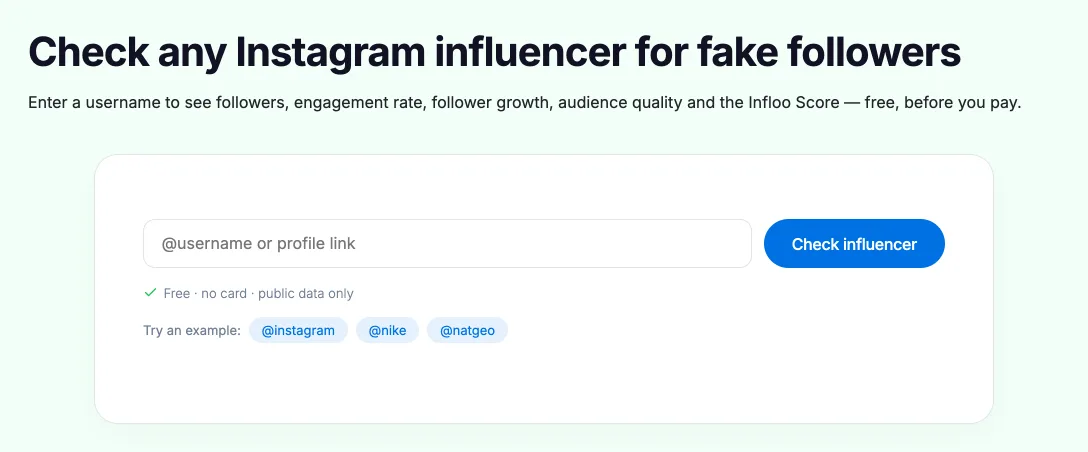
Run an account audit on each surviving candidate and read the real-versus-suspicious follower share alongside the growth curve. Sudden vertical steps in follower growth with flat engagement behind them are the pattern to catch. Only after that reading should you accept the rate as a planning input.
Then check audience location and demographics, which matters more in Brazil than in most markets because of how this ranking is built. An account listed under Brazil on reach — the 642.6M-follower entry at #1 being the extreme case — may deliver only a minority of its audience inside Brazil. A 1.06% rate over a global base is a very different media buy from a 1.06% rate over a Brazilian one.
Flag every account whose rate clears the floor only because the follower base looks inflated, and record the reason you dropped it. That record is what lets you defend a shortlist that excludes a famous name the client expected to see.
Exit this stage with a shortlist where each candidate carries three attached figures: engagement rate, audience-quality reading, and location split.
Stage 6 — Ship the shortlist with its limits stated, so the numbers survive review
Write the methodology into the deliverable in your own words. These figures come from the 50 Instagram accounts with the most followers in Brazil, and from a wider sample of 1,337 Instagram and TikTok accounts — those with the most followers across 14 locations — as of 15 September 2026. It is a sample of the largest accounts, not a census of Brazilian Instagram or of the platform population. Quote the source every time you quote a number.
Can I use these Brazil figures for micro-influencer planning?
Not on Instagram. Every account in the Instagram sample sits in the 1M+ tier — 700 of 700, 100% — so the data supports no claim whatsoever about how engagement varies with follower size on Instagram. The thinner tiers are empty because of how the sample was drawn, not because of anything about the platform. If you need a size-based rule from this dataset, TikTok's tier breakdown is the only place size differences are measurable: 5.87% under 10K, 6.96% for 10K–100K, 6.79% for 100K–1M and 10.45% for 1M+. Anything else about micro-influencers needs data collected for micro-influencers.
Frame the benchmarks as relative indexes, too. "Brazil at 0.29% versus 0.51% overall" and "Fashion at 0.23% versus Sports at 1.04%" are comparisons between markets and categories. Neither is an absolute pass mark for an individual creator, and a single account beating or missing a median tells you very little on its own.
Finally, set a refresh rule. Country and category medians move, so re-derive the floor from the current medians each planning cycle rather than reusing last quarter's percentage. A floor written as "1.5x the Brazil median" survives that refresh; a floor written as "0.44%" quietly stops matching the market.
What you hand over is then a shortlist a client can challenge line by line — every candidate with a rate, a category floor it cleared, an audience-quality reading, a location split, and a stated sample behind all of it.
Frequently asked questions
Why is engagement so much higher on TikTok in Brazil?
Part is real and part is sample composition. The TikTok sample is 63.1% accounts above 1M followers while Instagram is 100%, and TikTok's 1M+ tier medians 10.45% versus 6.79% for 100K–1M. TikTok also measures views per follower at 17.41% median, letting you separate accounts that reach beyond their base from those that only farm their own audience.
Is 0.29% a bad engagement rate for a Brazilian influencer?
No—0.29% is the median of Brazil's 50 largest Instagram accounts, so half sit below it. It is low against the 0.51% overall median and Argentina's 1.72%, but that does not mean underperforming for the market. The caveat is the sample covers only 1M+ follower accounts as of 15 September 2026; smaller Brazilian creators read differently.
How do I set a different engagement floor for fashion versus football creators in Brazil?
Express the floor as a multiple of the category median, not a blanket percentage. Fashion medians 0.23%, so a 1.5x floor is 0.35%. Football & Soccer medians 0.89%, so 1.5x is 1.34%. One profile may carry multiple categories: pick the one matching the campaign deliverable, not the flattest one. Encode the result in search filters so every colleague gets the same shortlist.
Should I pick the biggest Brazilian accounts first and filter later?
No—follower rank predicts nothing about engagement in the top 10. Rank #7 engages at 3.92%, rank #9 at 0.11%, a 35x spread. Sort by the category floor you set in Stage 3 instead. Also avoid the totals trap: the combined 1.16bn followers across the 50 accounts is not unique reach because audiences overlap heavily.
Who is the most-followed Instagram account in Brazil?
As of 15 September 2026, @cristiano (Cristiano Ronaldo) tops the Brazil ranking with 642.6M followers and 1.06% engagement, categorised under Football & Soccer, Handball, Sports, Volleyball, Basketball and Rugby. Its presence at #1 shows this is a reach index, not a roster of Brazilian creators.
Can I use these Brazil figures for micro-influencer planning?
Not on Instagram—all 700 sampled Instagram accounts sit in the 1M+ tier, so the data supports no claim about how engagement varies with follower size. On TikTok, size differences are measurable: under 10K medians 5.87%, 10K–100K medians 6.96%, 100K–1M medians 6.79%, and 1M+ medians 10.45%. Micro-influencer planning needs data collected for micro-influencers.