Log in







What Engagement Rate Should You Require From an Influencer? A Step-by-Step Way to Set Your Own Benchmark


What is in this article
- Start by fixing one baseline per platform, not one number for both
- Adjust the baseline for the market you are actually buying in
- Adjust a second time for the category the creator posts in
- Decide whether follower size can move your threshold — and admit when it can't
- On TikTok, add a reach check so engagement rate is not your only gate
- Screen out the accounts whose engagement rate cannot be trusted
- Turn the threshold into a reusable selection rule
Start by fixing one baseline per platform, not one number for both
Among the largest accounts in our ranking sample, the Instagram median engagement rate is 0.51% and the TikTok median is 9.05%. That is an 18x gap. Any brand using a single "good engagement rate" number across both platforms is guaranteed to be wrong on at least one of them — usually by approving weak TikTok creators and rejecting strong Instagram ones.
So the first step is not to find the right number. It is to write down two numbers, one per platform, and never let them touch again.
| Platform | Accounts in sample | Median ER | Mean ER | Median followers |
|---|---|---|---|---|
| 700 | 0.51% | 1.41% | 22,282,787 | |
| TikTok | 637 | 9.05% | 9.98% | 2,300,000 |
These figures come from a sample of 1,337 Instagram and TikTok accounts — the accounts with the most followers across 14 locations, measured on 30 July 2026. It is not the full platform population. Every number in this guide describes very large accounts, and figures for smaller creators will differ. Where that matters most, I will say so explicitly rather than let you carry a 1M+ benchmark down to a 40K creator.
One detail worth pausing on: on Instagram the mean (1.41%) is nearly three times the median (0.51%). That is a heavily skewed distribution — a minority of accounts with very high rates drag the average upward while the typical account sits far below it. When a deck quotes an "average engagement rate" without saying whether it is a mean or a median, assume it is a mean and assume it is flattering. Benchmark against medians; half the sample is below the median by definition, which is exactly the property you want in a pass mark.
Why is TikTok engagement so much higher than Instagram engagement?
In the same snapshot, on the same day, across the same 14 countries: TikTok median 9.05%, Instagram median 0.51%. That is what the data shows. The two platforms count interactions against followers under different mechanics, and our sample measures each on its own terms — so the honest conclusion is that the two scales are not convertible. There is no multiplier that turns an Instagram threshold into a TikTok one. Set them separately, from separate baselines, and stop comparing a creator's Instagram rate to their TikTok rate as if one validates the other.
How do I calculate an influencer's engagement rate consistently?
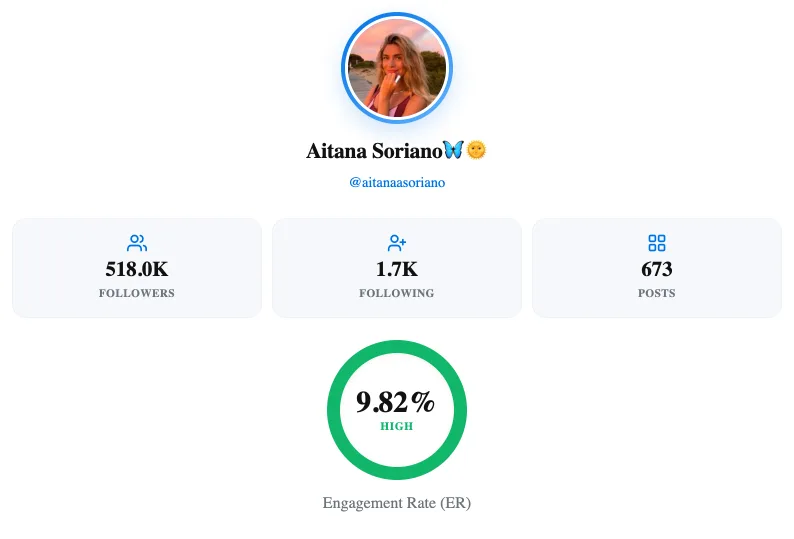
The method matters more than the number. If your benchmark was built one way and your candidate measured another, the comparison is meaningless. Run every shortlisted profile through the same engagement rate calculator so the input and the benchmark match. In one worked example, a 518K-follower account returns 9.82% and is flagged as high — useful context, but only because the same calculation is applied to every other candidate on the list.
Before moving on: two baselines written down, each with its platform noted next to it — Instagram 0.51%, TikTok 9.05% — plus a one-line note of where they came from.
Adjust the baseline for the market you are actually buying in
Country moves the bar further than most brands expect. On Instagram, the country medians in our sample run from 1.72% in Argentina down to 0.07% in Indonesia — a 24x spread inside the same platform, same snapshot, same sampling method.
| Country | Instagram median ER (50 accounts each) |
|---|---|
| Argentina | 1.72% |
| Mexico | 0.93% |
| Turkey | 0.9% |
| Spain | 0.78% |
| India | 0.74% |
| Ukraine | 0.58% |
| Italy | 0.58% |
| Portugal | 0.53% |
| United Kingdom | 0.51% |
| United States | 0.39% |
| Brazil | 0.29% |
| France | 0.23% |
| Germany | 0.22% |
| Indonesia | 0.07% |
TikTok reorders the table rather than repeating it: Mexico 13.94%, Spain 11.46%, France 10.91%, United Kingdom 9.58%, United States 9.21%, Germany 9.16%, Brazil 8.98%, Portugal 8.45%, Italy 7.5%, Ukraine 6.29%, Turkey 5.99%, Indonesia 3.91%. India shows 12.32% but rests on just 3 accounts — treat it as indicative only, not as a threshold you would reject a creator against. Note that Turkey sits near the top on Instagram (0.9%) and near the bottom on TikTok (5.99%); a single "Turkey benchmark" would be wrong on one of the two.
What engagement rate should I require in the United States versus Germany?
On Instagram, the US median is 0.39% and the German median is 0.22%. So a creator at 0.5% is a modest beat in the US and more than double the typical rate in Germany — the same absolute figure, two different verdicts. On TikTok the two markets sit almost on top of each other: 9.21% for the US and 9.16% for Germany, so the same TikTok pass mark can reasonably serve both. The lesson is not "always adjust by country" but "check whether country matters on this platform before you assume it does".
A country ranking is more useful as a live benchmark than as a leaderboard. Open the Argentina Instagram ranking and read the engagement column as a distribution: where does your candidate fall inside the accounts already competing for the same audience? That is the comparison your threshold is meant to encode.
Before moving on: a country-adjusted floor per platform for every market in the campaign, not one global floor.
Adjust a second time for the category the creator posts in
Category shifts the bar again, and in a direction that catches fashion and beauty teams out constantly.
| Instagram category | Accounts | Median ER |
|---|---|---|
| Sports | 113 | 1.04% |
| Rugby | 133 | 1% |
| Football & Soccer | 157 | 0.89% |
| Volleyball | 154 | 0.89% |
| Handball | 144 | 0.89% |
| Entertainment | 191 | 0.75% |
| Singer | 114 | 0.72% |
| Movies & TV Shows | 128 | 0.58% |
| Actors or Actress | 101 | 0.57% |
| Romantic Relationships & Dating | 165 | 0.51% |
| Lingerie & Intimates | 115 | 0.43% |
| Love & Intimacy | 118 | 0.41% |
| Fashion Trends | 132 | 0.33% |
| Shopping & Fashion Travel | 109 | 0.33% |
| Fashion | 97 | 0.23% |
Sports sits at 1.04% and Fashion at 0.23% — roughly four and a half times apart. A fashion brand that borrows a sports-derived threshold will reject its entire relevant pool and then conclude that "fashion influencers don't engage". They engage; they engage on a different scale. Category sample sizes here run from 97 to 191 accounts, so the larger ones (Entertainment, Romantic Relationships & Dating, Football & Soccer) carry more weight than the thinner ones, which are directional.
Combine country and category into one threshold rather than stacking two separate filters. Two filters applied in sequence will empty your shortlist: a Fashion creator in Germany is being asked to clear a below-median category bar in a below-median country simultaneously. Instead, pick the dimension that dominates your buy — usually category if the campaign is niche, usually country if it is a broad market launch — set the pass mark from that median, then use the second dimension to explain outliers rather than to cut them.
Is a 1% engagement rate good on Instagram?
Against our sample of the largest accounts, 1% is roughly double the overall Instagram median of 0.51%, which sounds decisive until you place it. It is about the median for Rugby (1%) and just under Sports (1.04%) — so for an athlete, 1% is ordinary. And it sits well below the Argentina country median of 1.72%, so for an Argentine account, 1% is below typical. For a Fashion creator in Germany, 1% would be exceptional. Again, this sample covers accounts with the most followers across 14 locations as of 30 July 2026; a 1% reading on a 40,000-follower account is not something these numbers can judge.
Before moving on: one numeric pass mark per platform-country-category combination on your shortlist.
Decide whether follower size can move your threshold — and admit when it can't
The received wisdom is that smaller accounts engage harder. Our TikTok sample does not show that.
| TikTok tier | Accounts | Median ER | Mean ER |
|---|---|---|---|
| Under 10K | 33 | 5.87% | 8.01% |
| 10K–100K | 62 | 6.96% | 9.1% |
| 100K–1M | 140 | 6.79% | 7.99% |
| 1M+ | 402 | 10.45% | 10.97% |
Do smaller influencers always have higher engagement rates?
Not in this sample. On TikTok, the 1M+ tier posts the highest median at 10.45%, against 6.79% for 100K–1M and 5.87% for accounts under 10K. That reverses the usual assumption. Weight the tiers by how many accounts sit in each: 402 accounts in 1M+ and 140 in 100K–1M are reasonably solid, while 33 accounts under 10K is thin enough to treat as a hint rather than a rule.
On Instagram the question cannot be answered at all with this data. All 700 accounts fall in the 1M+ tier, because the rankings quote the top-ranked accounts per country. The empty tiers reflect how the sample was drawn, not how the platform behaves — so any Instagram claim about size versus engagement is unsupported here, in either direction.
The practical move is to set size and engagement filters together rather than one after the other. In influencer search, defining the follower band and the engagement floor in the same query stops you from applying a 1M+-derived Instagram number to mid-tier creators it was never measured on.
Before moving on: a written decision on whether your threshold flexes by follower size, with the reason attached — including "we don't have Instagram evidence for this, so it doesn't flex" if that is the honest answer.
On TikTok, add a reach check so engagement rate is not your only gate
Engagement rate on TikTok tells you how many people interacted relative to followers. It tells you nothing about how many people saw the video. In our TikTok sample the median average views is 327,058 and the median views per follower is 17.41%, against median followers of 2,300,000. Those two numbers together are your second gate.
Views per follower catches what engagement rate hides: a strong like-and-comment ratio on posts that barely circulate. A creator can clear a 9% engagement bar while distributing to a fraction of their follower base, and your cost per view quietly triples. Conversely, a creator at 7% with views per follower well above 17.41% is reaching beyond their own audience — which is usually what you are paying for.
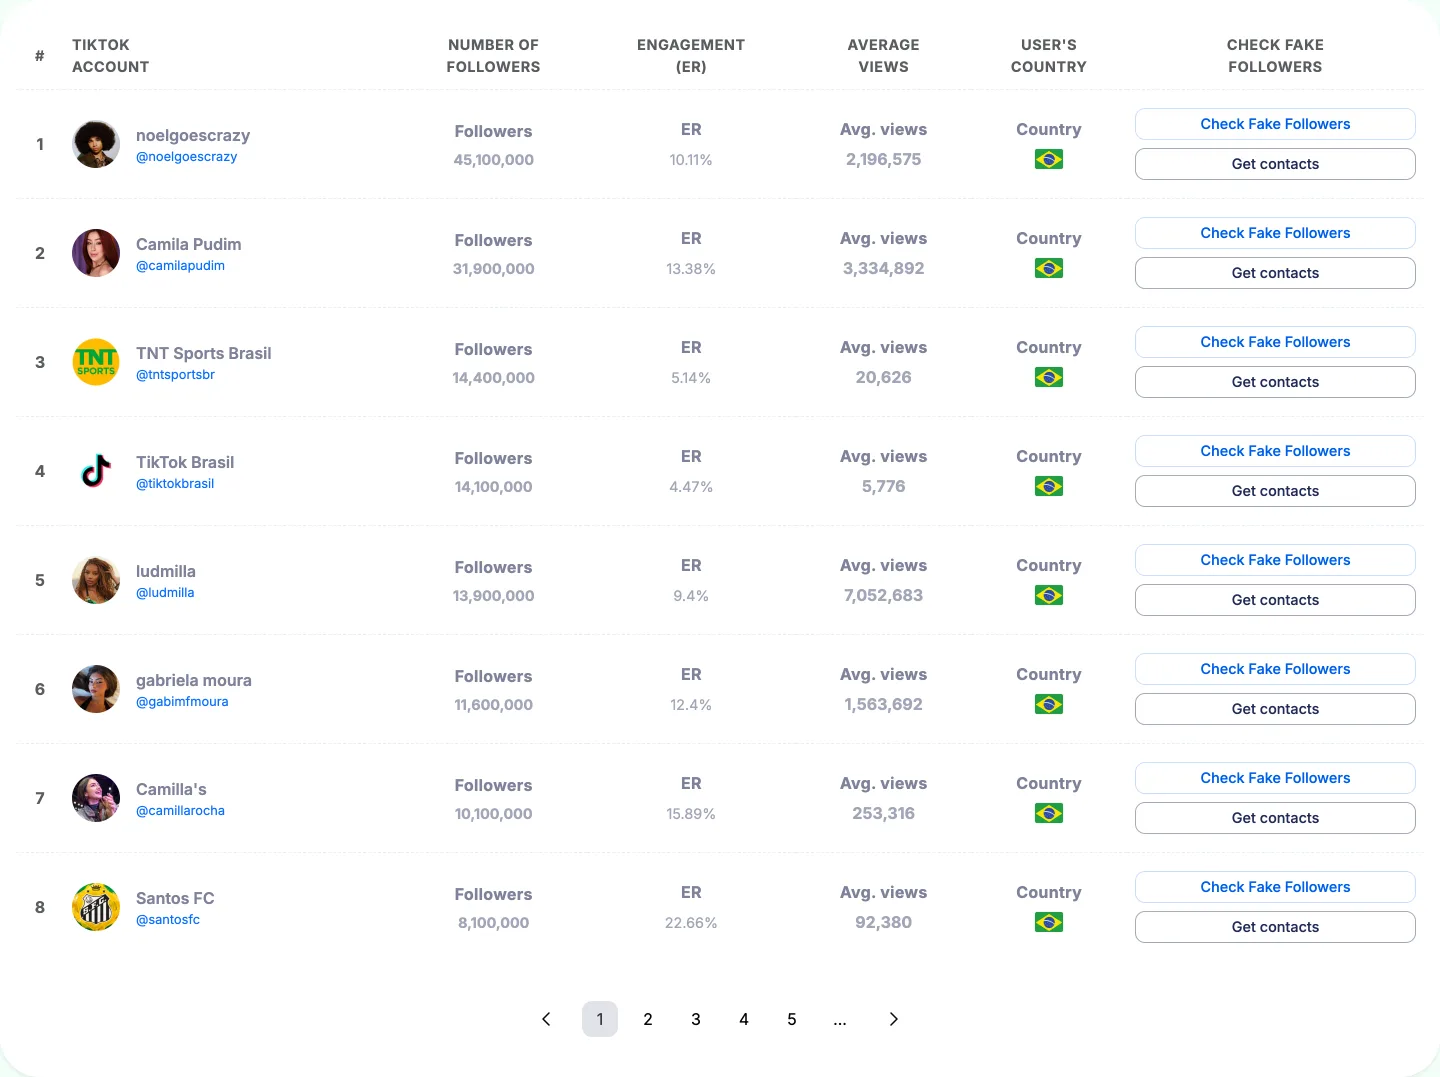
Read the three columns side by side rather than sorting on one. On the Mexico TikTok ranking, followers, engagement rate and average views per video sit in the same row, so you can see immediately whether a 13%+ rate is backed by view volume or is a small, loyal, low-reach audience. Both can be a valid buy — they are just different buys, priced differently.
Before moving on: a two-number TikTok threshold — an engagement rate floor and a views-per-follower floor.
Screen out the accounts whose engagement rate cannot be trusted
An engagement rate is a ratio, and the denominator has to be real for the ratio to mean anything. Run every shortlisted profile through an audience quality check before you compare it to your threshold, not after. The breakdown can return cases as extreme as 73.3% suspicious followers against 26.7% real — a profile where no engagement figure, high or low, tells you anything useful about reachable humans.
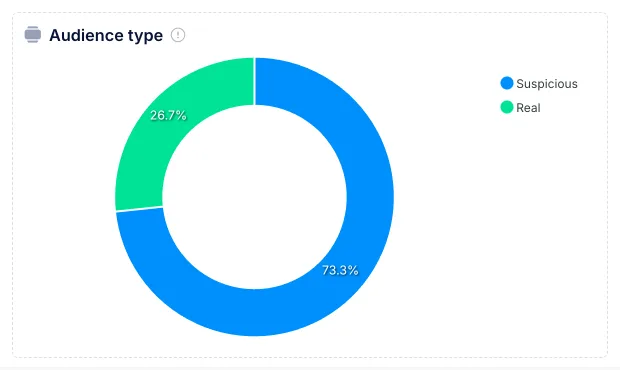
Use the composite quality score as a second gate rather than a verdict. In our tooling, one profile scores 81 out of 100 and is rated very good; another scores 67 out of 100 with a 72.7% real audience. Neither number is a pass or a fail on its own — the 67 may be perfectly buyable in a market where you have few alternatives, provided you know what you are buying. Then check the follower growth curve for step changes: a vertical jump followed by a flat line often explains an engagement rate that looks suspiciously cheap for the follower count. Our guide to detecting fake followers on Instagram and TikTok covers what those patterns look like in practice.
Should I reject a creator purely for being below my engagement threshold?
No. Pair the threshold with the audience check, and on TikTok with views per follower. A creator with a verified real audience at 8% will usually outperform one at 12% whose follower base is largely suspicious, because the second number is calculated against a denominator that does not convert. The threshold is a sorting tool, not a judgment. Below-threshold creators with clean audiences and strong reach belong in a "review" pile, not the bin.
Before moving on: a shortlist where every remaining creator clears both the numeric threshold and the audience check.
Turn the threshold into a reusable selection rule
Write the rule as one line per platform-country-category, with four parts: baseline, adjustment, pass mark, and provenance. For example: Instagram / Germany / Fashion — baseline 0.51% (Instagram median), adjusted down for Germany 0.22% and Fashion 0.23%, pass mark 0.25%, from the 1,337-account ranking sample dated 30 July 2026. Anyone reading that line later can see not just the number but whether it applies to their case.
Attach the methodology caveat to the rule itself, in the same line. The Instagram figures are drawn entirely from 1M+ accounts; if someone applies that 0.25% pass mark to a 40,000-follower German creator, the rule should tell them on sight that it was never measured on accounts that size. Caveats stored in a separate document are caveats nobody reads.
How often should I rebuild my engagement benchmark?
These medians are a snapshot dated 30 July 2026, not a constant. Re-check the country and category medians at the start of each planning cycle rather than reusing a number indefinitely — country figures in particular move, and a 24x spread between the top and bottom Instagram markets means small shifts in the middle of that range change pass marks materially. Set an explicit review date on the rule so an aging benchmark expires instead of quietly becoming policy.
Finally, export the shortlist with the threshold noted beside each creator. When the approvals conversation is about one agreed number, per platform, per market, per category, you stop arguing about whether 1% is good and start arguing about the only thing that matters: whether this specific creator clears the bar you set for this specific buy.
Frequently asked questions
Why is TikTok engagement so much higher than Instagram engagement?
In the same snapshot across the same 14 countries, TikTok median was 9.05% and Instagram median was 0.51%. The two platforms count interactions against followers under different mechanics, so the scales are not convertible and should be set separately from separate baselines.
What engagement rate should I require in the United States versus Germany?
On Instagram, the US median is 0.39% and Germany is 0.22%, so a creator at 0.5% beats the US median but is more than double the German median. On TikTok the two sit nearly together at 9.21% and 9.16%, so country matters less on that platform.
Is a 1% engagement rate good on Instagram?
Against the sample of largest accounts, 1% is roughly double the overall median of 0.51%, but it is about the median for Rugby (1%) and just under Sports (1.04%), so for an athlete 1% is ordinary. For a Fashion creator in Germany, 1% would be exceptional.
Do smaller influencers always have higher engagement rates?
On TikTok, the 1M+ tier posts the highest median at 10.45%, against 6.79% for 100K–1M and 5.87% for accounts under 10K, which reverses the usual assumption. On Instagram, all 700 accounts fall in the 1M+ tier, so the question cannot be answered with this data.
Should I reject a creator purely for being below my engagement threshold?
No. A creator with a verified real audience at 8% will usually outperform one at 12% whose follower base is largely suspicious, because the higher number is calculated against a denominator that does not convert. Pair the threshold with the audience check before making a final decision.
How often should I rebuild my engagement benchmark?
Re-check country and category medians at the start of each planning cycle rather than reusing a number indefinitely. These figures are a snapshot dated 30 July 2026, and a 24x spread between top and bottom Instagram markets means small shifts change pass marks materially.