
 Log in





Instagram fake follower checker: free audience audit
Enter a public Instagram username to see how much of its engaged audience looks real, the engagement rate against the follower count, the follower growth and the Infloo Score — free, before you pay for a collaboration.
Free · no card · public data only
What the free check reveals
- The share of real people, influencers and suspicious accounts in the engaged audience — and of mass followers, where a full report is collected.
- The engagement rate against the follower count.
- How the follower count has changed over time.
- The Infloo Score: audience quality from 0 to 100.
What a report looks like
This is part of a real free report for a public creator account, without the profile’s name. It takes a few seconds for an account we already know and up to a minute for a new one.
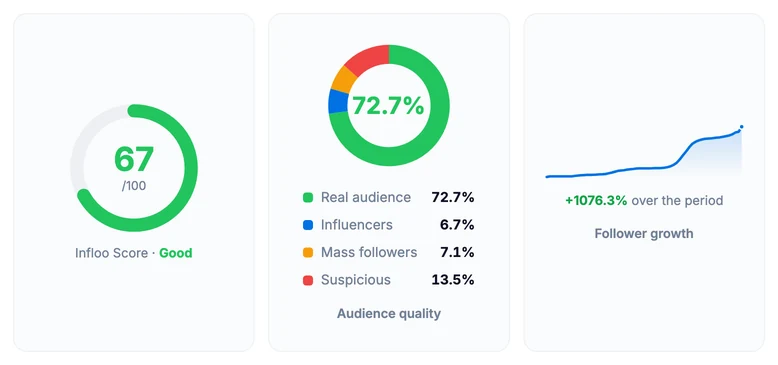
- Infloo Score — one number from 0 to 100 and its band, from Very poor to Excellent.
- Audience quality — how the accounts that engage with the posts split into real people, influencers, mass followers and suspicious accounts.
- Follower growth — how the follower count changed over the period we track. A steep step deserves a second look.
- Profile numbers — below the charts, a live report adds followers, engagement rate, posts and following.
How the check works
Most fake follower checkers give you a percentage without saying where it comes from. Here is exactly how we calculate a report today, so you can decide how far to trust it.
The audience sample
Instagram does not let anyone read a large account’s full follower list, so we start where the audience shows itself: a sample of the accounts that liked the last 5 posts — the people who actually see the content and react to it. Two of the groups below also need each account’s own follower and following counts; we look those up for a sub-sample of up to 170 of these accounts and stop earlier once the result settles.
- Real audience. What is left once the three groups below are taken out. Each group’s share is estimated separately — on the whole sample or on the sub-sample, as noted below — and one account can fall into more than one group, so the shares are estimates, not a head count. When the three together pass 100%, the real share is zero and they are scaled down to fit.
- Influencers. Accounts with 5,000 or more followers of their own, counted on the sub-sample. A quick Lite check, which has no sub-sample, counts the verified accounts among the likers instead.
- Suspicious. Accounts that look like bots, counted on the whole sample: no profile photo, no display name or a name with no vowels, a username with many digits or a long run of them. One sign alone is not enough; it takes several together.
- Mass followers. Accounts that follow 1,500 or more profiles, and at least 2 times as many as follow them, counted on the sub-sample. Their feed is so crowded that few posts reach them. The full report has them; a quick Lite check leaves them out.
How the Infloo Score is calculated
The Infloo Score adds up three parts. 50% is authenticity: the share of real people and influencers. 40% is engagement: the engagement rate of the posts the check reads, measured against 6%, the level at which this part is full. 10% is how regularly the account posts. The total, from 0 to 100, falls into one of six bands:
| Band | Score |
|---|---|
| Excellent | 90–100 |
| Very good | 80–89 |
| Good | 60–79 |
| Average | 40–59 |
| Poor | 20–39 |
| Very poor | 1–19 |
What the check cannot see
Bought followers who never like anything do not appear among the likers, so the sample cannot count them. They show up elsewhere: as an engagement rate far below what accounts of that size get, and as a sudden step on the growth chart. That is why engagement is 40% of the score, and why the score is best read together with the growth chart, not on its own. Two more things to know: the engagement rate on the report card comes from the profile’s data and can differ from the one in the score, and a report collected before June 2026 came from our earlier method — a data update recalculates it.
How we collect the data and define every other metric on infloo: our methodology.
What each number means
- Infloo Score
- Audience quality in one number. From 60 the band reads Good, from 80 Very good. Below 40, find out what pulls it down — a weak audience or weak engagement — before you pay for a post.
- Audience quality
- Who is behind the likes. Real people are the audience a brand pays for. Influencers are real too, but rarely buy. Mass followers see few posts. Suspicious accounts are the bot-like part — a few always turn up, a large share means some of the engagement is not organic.
- Engagement rate
- Average likes and comments per recent post divided by followers. Large accounts get a lower rate as a rule, so compare it with accounts of the same size, not with a small creator.
- Follower growth
- The change in followers over the period we track. Steady growth is normal; tens of thousands gained in a few days with no viral post behind them is the classic trace of a purchase.
Red flags worth a second look
- Many followers, but an engagement rate far below accounts of the same size.
- A sharp step on the growth chart that the posts of those days do not explain.
- A large suspicious share. Read the comments too: dozens of one-word or emoji-only comments point the same way.
Checking a creator before a collaboration
- Run the check and look at the Infloo Score and the audience split first: in a few seconds they tell you whether the account deserves a closer look.
- Compare the engagement rate with accounts of the same size in the same country, and look for steps on the growth chart.
- If the numbers hold up, open the report with a free account and make sure the audience lives in your market and matches your buyers by gender and age. Where we only have the quick check, the geography needs a data update: a free account can request one for accounts under 15,000 followers, a paid plan for any account.
To see what is normal for a country and a niche, compare the engagement rate with the median in our Instagram engagement rate benchmarks.
To check an account by hand, follow our step-by-step guide: how to spot fake followers on Instagram and TikTok.
Free check, free account or Pro
The check on this page is free and needs no account. A free account opens profile reports with more detail; Pro is for regular work with creators.
| What you get | No sign-up | Free account | Pro |
|---|---|---|---|
| Checks | 3 checks every 24 hours | 10 profile reports, one-time | 200 profile reports a month |
| Infloo Score, audience quality, engagement rate, growth | Yes | Yes | Yes |
| Audience gender and age | No | Yes | Yes |
| Audience geography | No | Yes, in a full report | Yes, in a full report |
| Data updates on request | No | 1, one-time, for accounts under 15,000 followers | 75 a month |
| Data export | No | No | 100 a month |
| Price | $0 | $0 | $29.99 a month |
A quick Lite check has no audience geography; a data update collects the full report.
Every plan and its limits are on the pricing page.
Create a free account Start free — no card requiredFrequently asked questions
Is the fake follower check free?
Yes. The check on this page needs no account and no card: up to 3 accounts every 24 hours. A free account opens 10 profile reports; they show the audience’s gender and age, and its geography where the full report is collected.
How accurate is it?
It is an estimate from a sample, not a count of every follower. We read a sample of the accounts that liked the last 5 posts and look for bot signs, so the fewer likes an account gets, the smaller the sample and the less the result says. Read it together with the engagement rate and the growth chart.
Can it find bought followers?
Indirectly. Bought followers rarely like posts, so they do not appear in the sample. They show up as an engagement rate far below accounts of the same size and as sudden steps on the growth chart. Bought likes often do appear: many come from accounts that look like bots.
What is the Infloo Score?
Audience quality from 0 to 100: 50% authenticity of the engaged audience, 40% engagement rate, 10% posting regularity. 60 and above reads Good, 80 and above Very good.
Will the account owner know I checked?
No. The check reads only public data. The account gets no notification, and you need neither its password nor its consent.
Does it work for private accounts or TikTok?
No. A private account hides its posts and likes, so there is nothing to sample. The checker covers public Instagram accounts.
Check the audience before you pay for the post: a minute here can save a budget spent on followers who will never see it.
Other free tools
-
Engagement rate calculator
The ER of any public Instagram account in seconds, no signup.
-
Follower count history
An Instagram account’s follower count today and how it changed over time.
-
Influencer search
Instagram creators by country, city, niche, audience size and engagement.
-
Engagement rate benchmarks
Median Instagram engagement rate by country, niche and account size, updated monthly.
-
Influencer brief generator
A ready brief for creators, with the engagement benchmark of your niche in your country.
-
Influencer price calculator
What a post, a Reel and a Story cost, estimated from followers, engagement rate and country.