Log in


Which Countries Have the Highest Influencer Engagement Rates on Instagram and TikTok?


What is in this article
- What this sample is, and the three things it cannot tell you
- Instagram: a 24x spread across 14 markets, with Argentina at the top and Indonesia at the bottom
- TikTok: higher everywhere, but the market order is different
- Where the two league tables disagree — and by how much
- How much of the platform gap is behaviour and how much is sample construction
- Turning country medians into a usable per-market threshold
Argentina's largest Instagram accounts median 1.72% engagement. Indonesia's median 0.07%. Same dataset, same collection date, same account-size band — and a 24x gap between the two country cells. Any brief that carries one global engagement minimum will wave through every Argentine candidate and reject almost every Indonesian one before a human looks at a single profile.
The second problem is that the country order you learn on Instagram does not transfer. Turkey ranks 3rd of 14 on Instagram and 13th of 14 on TikTok. France does the opposite: 12th on Instagram, 4th on TikTok. If your planning assumption is "this is a high-engagement market", you are wrong roughly half the time as soon as you change platform. What follows is the per-market, per-platform baseline, plus a clear statement of what these numbers cannot be used for.
What this sample is, and the three things it cannot tell you
These figures come from our own rankings data: 1,337 Instagram and TikTok accounts — the accounts with the most followers across 14 locations — measured as of July 30, 2026. That is 700 Instagram accounts and 637 TikTok accounts. It is not the full population of either platform, and figures for smaller accounts will differ. Everything below describes the top of each market, not the middle of it.
First limit: the Instagram side is entirely 1M+ accounts. All 700 of 700 sit in the 1M+ tier, with a median follower count of 22,282,787. Nothing in the Instagram data describes how a 40K-follower creator in Germany or Brazil performs, and no follower-size effect can be measured on Instagram here at all, because there is only one tier to compare.
Second limit: the country cells are small. Each country contributes at most 50 accounts per platform. On TikTok there are four exceptions — India has 3 accounts, Turkey 39, Argentina 46 and Portugal 49. India's TikTok figure is indicative only and should not be used to rank the market against anything.
Third limit: this is a snapshot, not a trend line. One date, one measurement. It supports comparison between markets on July 30, 2026. It cannot support a statement that a market is rising, cooling, or "moving to TikTok".
How many accounts are behind each country figure?
Up to 50 per country per platform. Every Instagram country cell is a full 50. On TikTok, ten countries hit 50, Portugal has 49, Argentina 46, Turkey 39 and India 3. Treat Turkey, Argentina and Portugal as usable but slightly thinner; treat India as a signal, not a rank. In a 50-account sample, a one- or two-place move in the league table is noise — a few accounts landing differently would reorder it.
Instagram: a 24x spread across 14 markets, with Argentina at the top and Indonesia at the bottom
Across all 700 Instagram accounts, the median engagement rate is 0.51% and the mean is 1.41%. The mean sits nearly three times the median, which tells you the distribution is dragged upward by a small number of very high performers — so the median is the number to plan against.
| Country | Accounts | Median ER |
|---|---|---|
| Argentina | 50 | 1.72% |
| Mexico | 50 | 0.93% |
| Turkey | 50 | 0.9% |
| Spain | 50 | 0.78% |
| India | 50 | 0.74% |
| Ukraine | 50 | 0.58% |
| Italy | 50 | 0.58% |
| Portugal | 50 | 0.53% |
| United Kingdom | 50 | 0.51% |
| United States | 50 | 0.39% |
| Brazil | 50 | 0.29% |
| France | 50 | 0.23% |
| Germany | 50 | 0.22% |
| Indonesia | 50 | 0.07% |
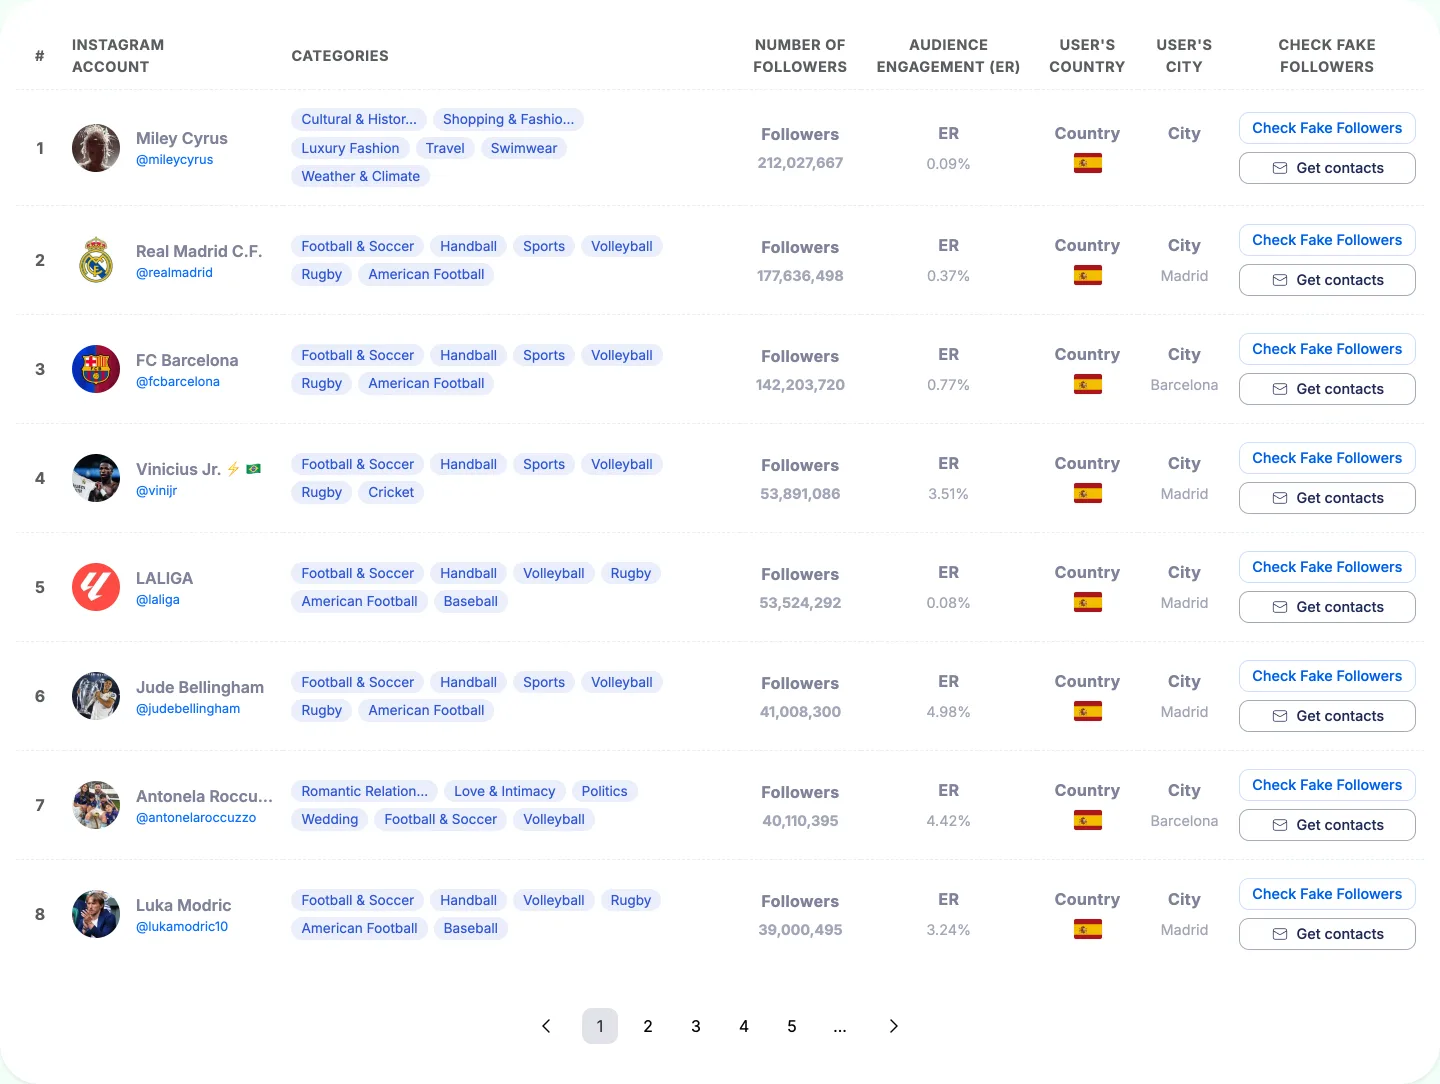
Argentina is an outlier at the top: 1.72% is nearly double second-placed Mexico at 0.93%, and the mid-band compresses fast — Turkey 0.9%, Spain 0.78%, India 0.74%, then Ukraine and Italy tied at 0.58%. You can inspect the accounts behind the top figure in the Argentina Instagram rankings.
Five markets sit below the 0.51% overall median — the United States, Brazil, France, Germany and Indonesia — and the United Kingdom sits exactly on it. Half the table is therefore at or below the global median, which makes "below the global median" the normal condition for a very large Instagram account in these countries, not a red flag.
Operationally, a 24x spread means the same raw number carries opposite meanings. A candidate posting 0.5% engagement in Argentina is running at under a third of their market's median. The same 0.5% in Indonesia is roughly seven times the local median for accounts of this size. One threshold cannot serve both, and if you are planning a campaign in a market at the bottom of this table, the Indonesia Instagram rankings show what the ceiling actually looks like there.
Which country has the highest influencer engagement rate?
It depends entirely on the platform. On Instagram, Argentina leads at a 1.72% median. On TikTok, Mexico leads at 13.94%. Both statements apply to the largest accounts in 14 markets as of July 30, 2026 and to nothing else. India's 12.32% TikTok median technically ranks second, but it rests on 3 accounts — quote it with that qualifier attached or leave it out of the comparison.
Is a 0.2% engagement rate on Instagram bad?
Not in every market. 0.2% sits close to the medians for Germany (0.22%) and France (0.23%), and just under the Fashion category median of 0.23%. In those contexts it is roughly par for a very large account. Against Argentina's 1.72% it is about one-eighth of the market median, which is a genuine problem. Judge the number inside the same country and the same category before you act on it — the Fashion Trends and Shopping & Fashion Travel medians both sit at 0.33%, while Sports sits at 1.04% and Rugby at 1%. A "low" rate in one vertical is an average rate in another.
TikTok: higher everywhere, but the market order is different
Across 637 TikTok accounts the median engagement rate is 9.05% and the mean 9.98% — a much tighter relationship between the two than on Instagram. Median followers are 2,300,000, median average views 327,058, and median views per follower 17.41%.
| Country | Accounts | Median ER |
|---|---|---|
| Mexico | 50 | 13.94% |
| India | 3 | 12.32% (indicative) |
| Spain | 50 | 11.46% |
| France | 50 | 10.91% |
| Argentina | 46 | 9.7% |
| United Kingdom | 50 | 9.58% |
| United States | 50 | 9.21% |
| Germany | 50 | 9.16% |
| Brazil | 50 | 8.98% |
| Portugal | 49 | 8.45% |
| Italy | 50 | 7.5% |
| Ukraine | 50 | 6.29% |
| Turkey | 39 | 5.99% |
| Indonesia | 50 | 3.91% |
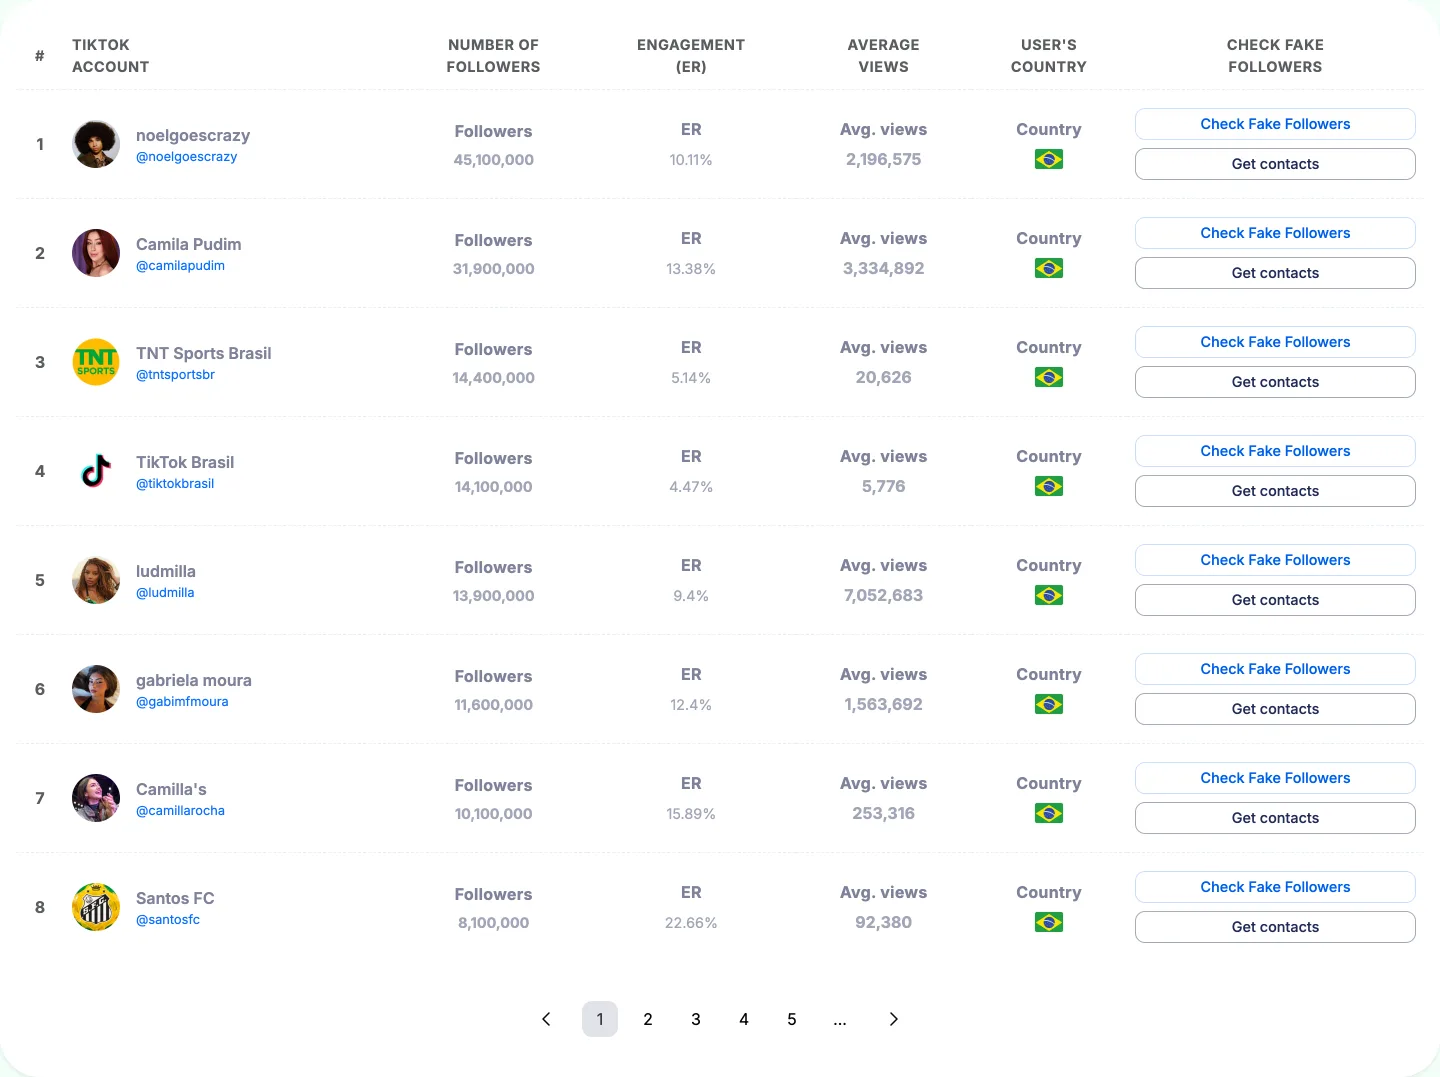
Top to bottom, Mexico's 13.94% is about 3.6 times Indonesia's 3.91%. Set that against Instagram's 24x and the planning implication is direct: on TikTok, which market you choose moves your expected engagement far less. Six of the fourteen markets sit between 8.45% and 9.7% — Argentina, the UK, the US, Germany, Brazil and Portugal are, for practical purposes, the same baseline. The Mexico TikTok rankings are where the top of that distribution lives.
Engagement rate also does not have to be the only screen on TikTok. The same accounts carry a median 327,058 average views and a median views-per-follower ratio of 17.41%, which gives you a reach-based reading of distribution rather than a reaction-based one. A creator with a soft engagement rate but a high views-per-follower ratio is being pushed beyond their follower base — a different kind of value, and one worth checking across the TikTok creator rankings before you cut them from a shortlist.
Where the two league tables disagree — and by how much
| Country | Instagram rank (median ER) | TikTok rank (median ER) |
|---|---|---|
| Turkey | 3rd (0.9%) | 13th (5.99%) |
| Ukraine | 6th (0.58%) | 12th (6.29%) |
| Italy | 7th (0.58%) | 11th (7.5%) |
| France | 12th (0.23%) | 4th (10.91%) |
| Germany | 13th (0.22%) | 8th (9.16%) |
| United States | 10th (0.39%) | 7th (9.21%) |
| Mexico | 2nd (0.93%) | 1st (13.94%) |
| Spain | 4th (0.78%) | 3rd (11.46%) |
| Indonesia | 14th (0.07%) | 14th (3.91%) |
Only the extremes survive the platform change. Mexico is top-two on both. Spain is 4th and 3rd. Indonesia is last on both. Those are the three markets where one expectation travels intact. Everywhere else, the platform resets the ranking: Turkey falls ten places, Ukraine six, Italy four, while France climbs eight and Germany five.
For planning, that means a market where your Instagram programme has been underwhelming is not automatically a weak market — France and Germany sit 12th and 13th on Instagram and 4th and 8th on TikTok. It also means a strong Instagram market gives you no promise on TikTok, as Turkey demonstrates.
Before anyone reorganises a budget around this: in a 50-account sample, small rank movements are not findings. The United States moving from 10th to 7th and the United Kingdom from 9th to 6th are inside that noise band, and the underlying medians barely separate those countries from their neighbours on TikTok anyway. Turkey's ten-place fall and France's eight-place climb are large enough to be worth testing.
How much of the platform gap is behaviour and how much is sample construction
Why is Instagram engagement so much lower than TikTok engagement in this data?
The observed gap is 0.51% median on Instagram against 9.05% on TikTok. That is real in this sample, but the two samples are not like-for-like, and the reason is visible in the tier split.
| Follower tier | Instagram share | TikTok share | TikTok median ER |
|---|---|---|---|
| Under 10K | 0% | 5.2% | 5.87% |
| 10K–100K | 0% | 9.7% | 6.96% |
| 100K–1M | 0% | 22% | 6.79% |
| 1M+ | 100% | 63.1% | 10.45% |
Every Instagram account here is 1M+. On TikTok, 36.9% of accounts are below 1M — and those tiers engage lower, not higher: 10.45% for 1M+ against 6.79% for 100K–1M and 5.87% for under 10K. So the TikTok sample includes account sizes the Instagram sample excludes entirely, and if anything that composition pulls the TikTok median down rather than up. What the data cannot do is separate the platform effect from the sampling effect cleanly, and on Instagram it cannot measure a follower-size effect at all, because there is exactly one tier.
The common misuse follows directly from this. Quoting the 9.05% TikTok median at a 50K-follower creator applies a mostly-1M+ benchmark to someone whose own tier medians 6.96%. That creator looks like an underperformer against a number that was never built for them. Match the benchmark to the tier before you match it to the person — the same reasoning behind our guide to setting an engagement rate requirement for influencers.
Turning country medians into a usable per-market threshold
Can I use these country medians as a minimum engagement requirement in a brief?
Only as a relative index. Divide a candidate's engagement rate by the median for their country and platform, and you get a score that is comparable across markets: a German Instagram creator at 0.44% scores 2.0 against the 0.22% German median, and an Argentine creator at 2.0% scores 1.16 against 1.72%. The German creator is further above their market, even though the Argentine posts a bigger raw number. Used as an absolute pass mark instead, these medians will systematically over-reject in Indonesia, Germany and France and under-reject in Argentina.
Two further constraints. These figures describe the biggest accounts in each market, so a mid-tier creator programme should expect different absolute numbers — and on Instagram specifically, this data says nothing whatsoever about accounts under 1M.
Should I shift budget to TikTok in markets where Instagram engagement is low?
The data supports checking, not assuming. France and Germany rank 12th and 13th on Instagram but 4th and 8th on TikTok, which is the pattern that justifies the question. Indonesia ranks last on both, which is the pattern that kills the rule. Turkey runs the reverse. Run the comparison market by market, using the two tables above as the starting point, and treat any single-platform weakness as a prompt to test rather than a conclusion.
Build the baseline into the shortlist, not the review
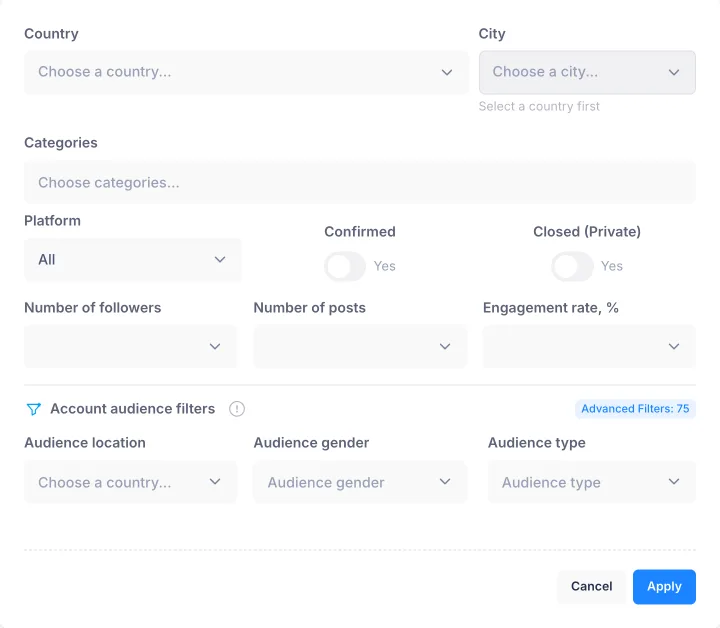
Apply the market filter before profiles reach a human. Filtering by country, category, follower band and engagement rate when you search for creators by market and engagement means the German shortlist arrives with a German threshold already applied and the Mexican one with a Mexican threshold — instead of one reviewer mentally adjusting for fourteen different baselines.
Screen audience quality first, then index. An inflated engagement rate outscores any median you compare it against, so the index calculation is only meaningful on accounts whose engagement has already survived a quality check. Order matters: verify, then rank.
Finally, write the sample limits into the brief alongside the numbers. State that the thresholds derive from 1,337 top-follower Instagram and TikTok accounts across 14 locations as of July 30, 2026, that all Instagram figures describe 1M+ accounts, and that the TikTok India figure rests on 3 accounts. A team running a 50K-follower programme in one of these markets needs to know, in writing, that these medians are not their benchmark.
Frequently asked questions
Which country has the highest influencer engagement rate?
On Instagram, Argentina leads at 1.72% median engagement. On TikTok, Mexico leads at 13.94% median. Both figures apply only to the largest accounts in 14 markets as of July 30, 2026.
Is a 0.2% engagement rate on Instagram bad?
Not in every market. 0.2% sits close to Germany's 0.22% and France's 0.23% medians, and matches the Fashion category median of 0.23%. Against Argentina's 1.72%, it is about one-eighth of the market median, which is a genuine problem. Judge the number within the same country and category.
Why is Instagram engagement so much lower than TikTok engagement?
The Instagram sample is 100% 1M+ accounts, while the TikTok sample is only 63.1% 1M+ accounts. The TikTok 1M+ tier alone medians 10.45% against 6.79% for 100K–1M. The observed 9.05% TikTok median versus 0.51% Instagram reflects sample composition differences as much as platform behaviour.
Can I use these country medians as a minimum engagement requirement in a brief?
Only as a relative index. Divide a candidate's engagement rate by their market median to get a comparable score across markets. Used as an absolute pass mark, these medians will systematically over-reject in Indonesia, Germany and France while under-rejecting in Argentina.
Should I shift budget to TikTok in markets where Instagram engagement is low?
The data supports checking, not assuming. France ranks 12th on Instagram but 4th on TikTok, suggesting investigation is worthwhile. Indonesia ranks last on both platforms, so the rule does not hold universally. Test market by market.