Log in







Engagement Rate, Views per Follower or Follower Count — Which Metric Should You Screen Influencers On?


What is in this article
- The three numbers, and the different question each one answers
- Side by side: the six axes that decide which metric leads your screen
- Engagement rate leads when you are ranking candidates inside a single country and category
- Views per follower leads on TikTok, because it audits the denominator engagement rate trusts
- The case for the loser: follower count is the right primary screen for reach buys
- Four briefs and the metric each should screen on first
- What this sample cannot settle
The three numbers, and the different question each one answers
A creator profile gives you three headline figures, and planners keep arguing about which one is "right". They are not rivals. Each answers a different question, and each breaks in a different place.
Every figure in this article comes from our own sample: 1,337 accounts — 700 on Instagram and 637 on TikTok — drawn as the most-followed accounts across 14 locations, measured on 15 September 2026. It is a sample of the top of the market, not the whole platform, and smaller creators will produce different numbers. Read every median below as "typical for a very large account", not "typical for a creator".
Engagement rate answers: how many of the followers react? Likes and comments divided by followers. In this sample the median is 0.51% on Instagram and 9.05% on TikTok. Those two numbers describe the same behaviour on two platforms that count it completely differently, which is the first reason a single threshold across platforms is meaningless.
Views per follower answers: how much of the follower base is actually being shown the post? Average views divided by followers. The TikTok median is 17.41%. This is the only metric of the three that audits whether the audience on paper is an audience in practice.
Follower count answers: how large is the theoretical audience? Median 22,282,787 on Instagram and 2,300,000 on TikTok in this sample. It says nothing about response — and it is still the most decision-relevant number on the profile for a whole class of campaigns.
Side by side: the six axes that decide which metric leads your screen
Before picking a primary screen, look at the three metrics on the axes that actually matter to a shortlist: what they measure, where they exist, what the typical value is, how far they move between markets, how far they move between categories or size tiers, and how they fail.
| Metric | What it measures | Where it exists in this data | Sample median | Movement by country | Movement by category / tier | Failure mode |
|---|---|---|---|---|---|---|
| Engagement rate | Share of followers who like or comment | Instagram and TikTok | 0.51% IG / 9.05% TT | Huge. IG 1.72% (Argentina) to 0.07% (Indonesia), a 24x spread. TT 13.94% (Mexico) to 3.91% (Indonesia), 3.6x | IG categories 1.04% (Sports) to 0.23% (Fashion). TT tiers 10.45% (1M+) to 5.87% (under 10K) | Divides by follower count, so a distorted denominator produces a clean percentage with nothing behind it |
| Views per follower | Share of the follower base served a typical post | TikTok only | 17.41% | Not broken out in this sample | Not broken out in this sample | Cannot be used as a cross-platform screen at all — there is no Instagram equivalent here |
| Follower count | Size of the theoretical audience | Instagram and TikTok | 22,282,787 IG / 2,300,000 TT | Comparable everywhere — the unit does not change between markets | 100% of the IG sample is 1M+; TT is 63.1% 1M+ | Silent about response. Predicts almost nothing about engagement quality |
Can I use one engagement-rate threshold across several countries?
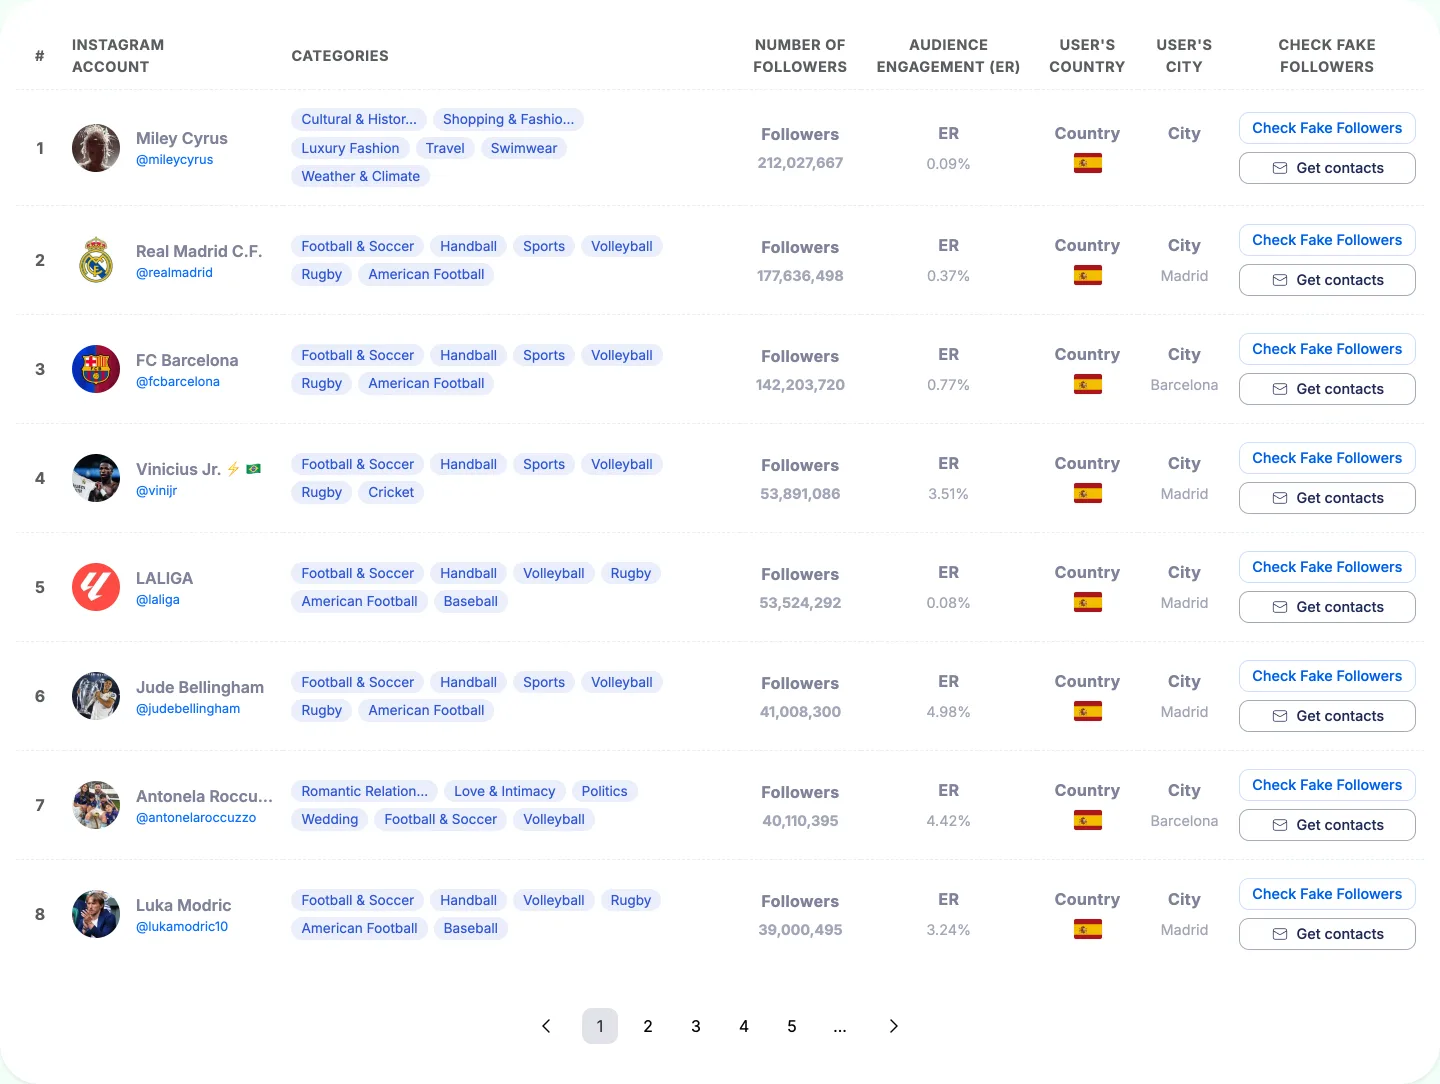
No. On Instagram, the country medians in this sample run from 1.72% in Argentina down to 0.07% in Indonesia. A 1% Instagram account is below the median in Argentina and an extreme outlier in Indonesia, Germany (0.22%) or France (0.23%). On TikTok the spread is narrower but still decisive: 13.94% in Mexico against 3.91% in Indonesia, with the UK at 9.58% and the US at 9.21%. A fixed "must be above 5%" TikTok rule would reject the median Indonesian and Turkish (5.99%) creator while waving through anything in Mexico. Rebuild the pass mark per market from that market's own median; the country-by-country engagement rate benchmarks give you the numbers to set it against.
Engagement rate leads when you are ranking candidates inside a single country and category
Engagement rate is a comparison metric, not an absolute one. Hold platform, country and category constant and the median becomes a usable pass mark. Let any of those three vary and it becomes noise.
The category spread inside Instagram makes the point on its own. Sports medians 1.04%, Rugby 1%, Football & Soccer 0.89%, Volleyball 0.89%, Handball 0.89%, Entertainment 0.75%, Singer 0.72% — and then Movies & TV Shows 0.58%, Actors or Actress 0.57%, Lingerie & Intimates 0.43%, Love & Intimacy 0.41%, Fashion Trends 0.33%, Shopping & Fashion Travel 0.33%, and Fashion at 0.23%. A 0.5% Fashion creator is performing at more than double their category median. A 0.5% Sports creator is at less than half theirs. Same number, opposite verdict.
Should I use the mean or the median engagement rate as a benchmark?
The median. In the same 700 Instagram accounts, the mean engagement rate is 1.41% against a median of 0.51% — the average is close to three times the midpoint. That gap is the signature of a small number of extreme performers dragging the arithmetic upward. Build your screen on the 1.41% mean and you set a bar that the typical large Instagram account fails, then quietly rationalise exceptions until the shortlist fills up. Build it on 0.51% and you are asking a real question: is this creator above or below the middle of their peer group? The same logic holds on TikTok, where mean (9.98%) and median (9.05%) sit closer together but the median is still the honest reference. Our guide on what engagement rate you should actually require from influencers works through where to set the bar above that midpoint.
Why is TikTok engagement so much higher than Instagram engagement?
The headline gap is 9.05% against 0.51% — roughly 18x. Part of that is genuine platform difference in how interaction is counted and how feeds distribute content. But a meaningful part is sample composition, and you should know that before you quote the ratio. Every one of the 700 Instagram accounts here sits in the 1M+ tier, while only 63.1% of the TikTok accounts do. TikTok's smaller tiers median lower — 6.79% at 100K–1M, 6.96% at 10K–100K, 5.87% under 10K — so the TikTok figure is being pulled down by creators who have no counterpart on the Instagram side. The direction of the gap is not in doubt; the exact multiple is a property of these two samples.
The failure mode to keep in mind throughout: engagement rate divides by follower count. If the denominator is inflated — dormant accounts, bought followers, an audience assembled years ago in a different market — the percentage falls, and a creator who buys engagement to match can produce a perfectly ordinary-looking rate with nothing real behind it. Checking an account's engagement rate against its own posting history tells you far more than the single profile-level number.
Views per follower leads on TikTok, because it audits the denominator engagement rate trusts
This is the metric that catches what engagement rate cannot. The TikTok sample medians 17.41% views per follower, built from median average views of 327,058 against median followers of 2,300,000. Read that plainly: the typical very large TikTok account in this sample is serving well under a fifth of its follower base on a given post.
That is the gap between the number a creator quotes in a pitch and the number your campaign will actually buy. A 2.3 million follower profile delivering 327,058 views per post is not a 2.3 million reach unit. Follower count overstates per-post reach by roughly six times at the median here, and the multiple varies enormously between individual accounts — which is exactly why the ratio is worth screening on rather than assuming.
What is a good views-per-follower ratio on TikTok?
Use 17.41% as your anchor. That is the median among the largest TikTok accounts in this sample, so a creator at or above it is serving their follower base at least as well as their peer group. Materially below it — single digits, say — is a signal worth investigating: the follower count exists but is not being served, whether because the audience went dormant, drifted off-market, or was never really there. Treat anything well above it as a creator whose content is reaching beyond followers into recommendation-driven distribution, which is usually good news for a reach buy and excellent news for an awareness one.
One caveat on the anchor: this median comes from large accounts only. Smaller creators, who are more dependent on algorithmic distribution than on follower loyalty, will not necessarily cluster around the same figure.
Pair views per follower with engagement rate rather than swapping one for the other. High engagement rate over a low view share describes a small, loyal core inside a large nominal audience — good for a comments-led activation, bad for a reach buy priced on follower count. Low engagement rate over a high view share describes broad distribution with shallow response, which is the correct profile for an awareness push.
Does views per follower exist for Instagram?
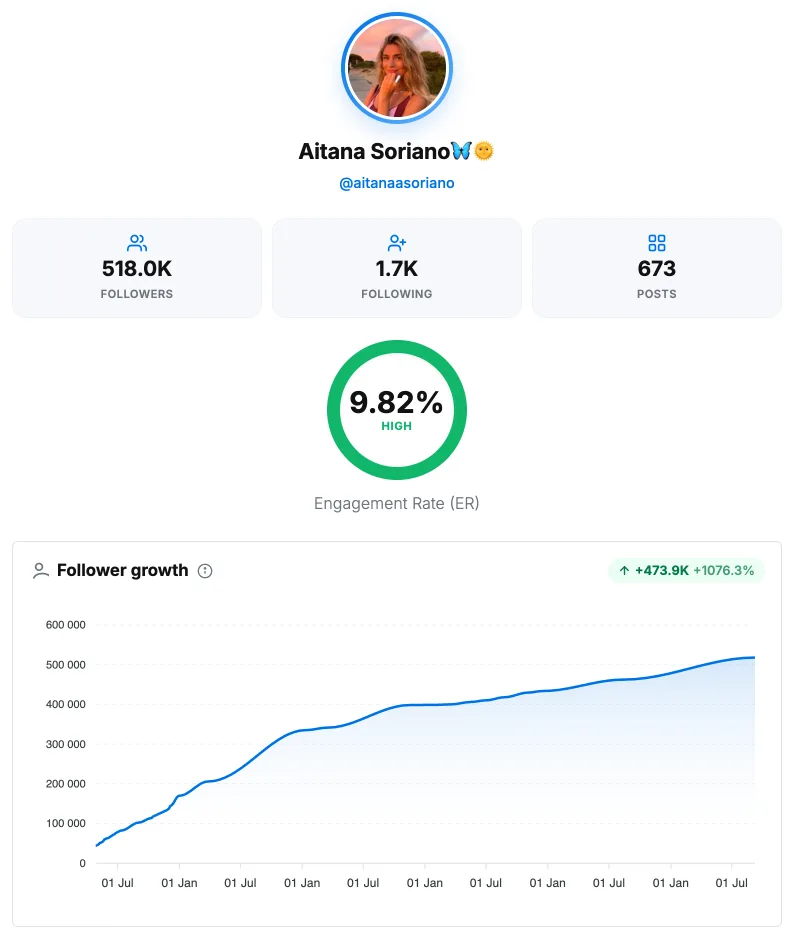
Not in this dataset. The view figures we hold cover TikTok only, so an Instagram screen has one fewer cross-check available and has to lean on engagement rate plus direct audience-quality work: checking how the follower count has grown over time, looking for step changes that do not correspond to anything, and reading comment quality rather than comment volume. It is a real asymmetry in how much confidence you can place in an Instagram shortlist versus a TikTok one.
The case for the loser: follower count is the right primary screen for reach buys
Follower count is the metric everyone dismisses, and for response-led work they are right to. It predicts almost nothing about engagement quality. But it is the only number in the set that answers "how many people could plausibly see this post", and for a whole category of campaigns that is the question.
When the objective is impressions, share of voice or launch-week saturation, response rate is the wrong filter. You are not buying comments. You are buying the top of a market, and the top of a market is defined by size. Our country rankings are reach indexes of the largest accounts — follower count is precisely what they sort on, and precisely what they are good for.
Is engagement rate or follower count more important when choosing an influencer?
Neither, in the abstract. The honest answer depends entirely on objective. Reach-led buys should lead on follower count and use engagement rate only as a tiebreaker between similarly sized candidates in the same market. Response-led buys should lead on engagement rate, compared against the median for that country and that category — not against a number carried over from the last campaign in a different market. Anyone who tells you one metric wins outright is describing their own most recent brief, not a rule.
Do bigger accounts always engage less?
Not in this sample. On TikTok the 1M+ tier medians 10.45% engagement rate against 6.79% for 100K–1M, 6.96% for 10K–100K and 5.87% under 10K. Size is associated with higher engagement here, not lower. That matters for reach buys: screening for scale on TikTok does not cost you response in this data, so the usual trade-off argument does not apply. On Instagram the question cannot be answered at all, because 100% of the 700 accounts sit in the 1M+ tier — there is no comparison tier to run the test against. Any "big accounts engage less on Instagram" claim built on this sample would be fabricated.
Four briefs and the metric each should screen on first
- National awareness push on Instagram. Follower count first — you are buying scale in one market, and every sampled account clears 1M, so size is the axis that still differentiates them. Use engagement rate as a within-country tiebreaker against that country's median: 0.39% in the US, 0.51% in the UK, 1.72% in Argentina.
- Performance-led TikTok activation. Views per follower first, against the 17.41% median — it tells you whether the audience is being served before you pay for it. Engagement rate second, against the country median and the relevant tier. Follower count last, as a volume constraint rather than a quality signal. If Mexico is in scope, the most-followed TikTok accounts in Mexico are the obvious starting pool, with the caveat that the Mexican median engagement rate of 13.94% sets a higher bar than anywhere else in the sample.
- Multi-market comparison. No single pass mark travels. Neither engagement rate nor views per follower is comparable across borders — a 1% Instagram rate is mid-table in Argentina and exceptional in Indonesia. Rebuild the threshold per country from that market's own median, then compare candidates only against their own market.
- Niche category buy on Instagram. Engagement rate against the category median, always. A 0.4% Fashion account is comfortably above its 0.23% category median; a 0.4% Sports account is well below its 1.04% one. The number is identical and the result is not. Start from a category-filtered creator search in the target market so the comparison set is right before you apply the threshold.
What this sample cannot settle
These figures describe 700 Instagram accounts and 637 TikTok accounts — the most-followed across 14 locations, as of 15 September 2026. They are an index of the top of each market. Creators in the 10K–500K range, where most brand programmes actually spend, will produce different medians, and nothing here should be extrapolated to them.
Three specific limits. First, no Instagram tier comparison is possible, because 100% of that sample sits in the 1M+ band — the rankings quote top-ranked accounts per country, so the empty tiers reflect how the sample was drawn, not the platform. Second, India's TikTok figure of 12.32% rests on just 3 accounts and should be read as indicative only; the other TikTok country medians sit on samples of 39 to 50. Third, there is no view data on the Instagram side, so views per follower cannot be used as a cross-platform screen.
The practical takeaway: treat all three metrics as relative indexes between candidates in the same market, on the same platform, in the same category — not as absolute pass marks you can carry from one brief to the next. The moment you fix a number and reuse it across borders, you have stopped screening and started filtering on geography by accident.
Frequently asked questions
Why can't you use one engagement rate threshold across multiple countries?
Country medians vary dramatically: Instagram ranges from 1.72% in Argentina to 0.07% in Indonesia, a 24x spread. TikTok ranges from 13.94% in Mexico to 3.91% in Indonesia, a 3.6x spread. A 1% Instagram account is below the median in Argentina but an extreme outlier in Indonesia. Thresholds must be rebuilt per market.
What's the difference between using mean vs median engagement rate as a benchmark?
The sample of 700 Instagram accounts shows a mean of 1.41% against a median of 0.51% — the average is close to three times the midpoint. A screen built on the mean sets a bar that the typical large account fails, while a median-based screen asks whether a creator sits above or below their peer group. The median is the honest reference.
What does views per follower actually measure on TikTok?
It measures whether the follower base is actually being shown posts. The TikTok median is 17.41%, built from median average views of 327,058 against median followers of 2,300,000. A 2.3 million follower profile delivering 327,058 views per post overstates per-post reach — the follower count overstates reach by roughly six times at the median.
What is a good views per follower ratio on TikTok?
Use 17.41% as your anchor, which is the median among large TikTok accounts in this sample. At or above it, a creator is serving their follower base at least as well as their peer group. Single digits signal the audience is not being served. Well above it signals content reaching beyond followers into recommendation-driven distribution, usually good for reach buys.
Do bigger accounts always have lower engagement rates?
Not on TikTok. The 1M+ tier medians 10.45% engagement rate against 6.79% for 100K–1M, 6.96% for 10K–100K and 5.87% under 10K. Size is associated with higher engagement in this data. On Instagram the question cannot be answered because 100% of the 700 accounts sit in the 1M+ tier, with no smaller comparison tier.