Log in







What Should You Check Before You Sign an Influencer? A Stage-by-Stage Yes/No Checklist


What is in this article
- How to score this checklist: which 'no' answers stop the deal and which only cost money
- Stage 1 — Definition: the brief resolves into inputs a search can actually take
- Stage 2 — Benchmark: you know the number a candidate must beat before you open a single profile
- Stage 3 — Screening: the candidate clears the bar on the numbers you can see without paying attention to anyone
- Stage 4 — Verification: the audience behind the rate is real, reachable and in your market
- Stage 5 — Sign-off: the decision is documented well enough to survive the post-campaign review
- Reading the finished sheet: three failure patterns and what each one means
How to score this checklist: which 'no' answers stop the deal and which only cost money
A 3% engagement rate is an excellent result on Instagram and a below-median result on TikTok. In our sample of 1,337 accounts, the Instagram median sits at 0.51% and the TikTok median at 9.05%. If you carry one threshold across both platforms, you either wave through every Instagram candidate or reject nearly every TikTok candidate. That is the single most common reason a creator shortlist is wrong before anyone has looked at a profile.
This checklist runs in five stages — definition, benchmark, screening, verification, sign-off — in that order, because each stage costs more than the one before it. Defining the brief costs an hour. Pulling a benchmark costs an afternoon. Screening costs a seat on a platform. Verification costs analyst time per candidate. Sign-off costs a contract. Running them out of order means paying the expensive step to discover something the cheap step would have told you.
The rule for reading a completed sheet: an unanswered item in Stage 1 or Stage 2 invalidates every answer below it. If you never fixed a country, your engagement pass mark is arbitrary, and every "yes" in Stage 3 was measured against nothing. Those are not creator failures — they are your process failures, and no amount of good verification data rescues them.
Every figure quoted below comes from the same source: a sample of 1,337 Instagram and TikTok accounts, the most-followed accounts across 14 locations, as of September 1, 2026. That is not the full population of either platform, and smaller accounts will differ. Because the sample is drawn from the largest accounts, treat all medians as relative indexes between markets and categories — Argentina versus Indonesia, Sports versus Fashion — and never as absolute pass marks handed down from the platform.
Stage 1 — Definition: the brief resolves into inputs a search can actually take
Have you named one country rather than a region? Coverage in this dataset is 14 countries on each platform. "Europe" and "LATAM" are not searchable inputs; they are shopping lists that get resolved by whoever assembles the shortlist, usually by guesswork. Cost of a no: a shortlist built on the assembler's instinct about which markets matter.
Have you named the platform before the creator? Country order does not transfer between platforms. Turkey ranks third on Instagram at 0.9% and thirteenth on TikTok at 5.99%. France is twelfth on Instagram at 0.23% and fourth on TikTok at 10.91%. A market that looks strong on one platform can be near the bottom on the other, so "find me French creators" without a platform produces two incompatible answers.
Have you fixed a category? Instagram category medians in the sample run from 1.04% (Sports, 113 accounts) down to 0.23% (Fashion, 97 accounts) — a factor of four and a half. Cost of a no: you put a Fashion creator and a Sports creator on the same sheet and conclude the Fashion creator underperforms, when they are simply being measured on someone else's scale.
Have you written down what the campaign is buying — reach, engagement or views? Each is a different column with a different pass mark. On TikTok you can screen on all three; on Instagram the sample gives you engagement and follower count only. Decide before you look, or you will retrofit the metric to whichever creator you already liked.
Stage 2 — Benchmark: you know the number a candidate must beat before you open a single profile
Is your pass mark platform-specific? Instagram medians 0.51%, TikTok medians 9.05% in this sample. A shared threshold is not a stricter filter, it is a broken one — it does not discriminate on the platform where it sits too low and it rejects everyone on the platform where it sits too high.
Is it country-adjusted? Instagram spans 1.72% in Argentina down to 0.07% in Indonesia — a 24x range within one platform. TikTok spans 13.94% in Mexico to 3.91% in Indonesia. India's TikTok figure of 12.32% rests on three accounts and should be treated as indicative only, not as a benchmark you negotiate against. If you are running Argentina and Germany (0.22% on Instagram) off the same sheet, you will sign every Argentine creator and none of the German ones, and the difference will have nothing to do with creator quality.
Is it category-adjusted on Instagram? The spread within the sample: Sports 1.04%, Rugby 1%, Football & Soccer 0.89%, Entertainment 0.75%, Fashion Trends 0.33%, Fashion 0.23%. A 0.6% rate is a comfortable pass in Fashion and a clear fail in Sports. Our full breakdown of what engagement rate to require from influencers works through how to combine the country and category adjustments into one number.
Are you applying a size rule only where the data allows one? On TikTok, the tiers differ measurably: 10.45% median at 1M+, 6.79% at 100K–1M, 6.96% at 10K–100K, 5.87% under 10K. On Instagram, all 700 sampled accounts sit in the 1M+ tier — the rankings quote the top accounts per country, so the empty tiers reflect how the sample was drawn, not the platform. No size-based rule for Instagram can be justified from this data at all.
Cost of a no anywhere in Stage 2: you negotiate rates against a number you cannot defend, and when the campaign underdelivers you have no baseline to show it was a reasonable bet. Pull the current figures from the engagement rate benchmark tool before you build the sheet.
Stage 3 — Screening: the candidate clears the bar on the numbers you can see without paying attention to anyone
Does the engagement rate beat the country-and-category median you set in Stage 2 — not the overall median? The overall Instagram median of 0.51% is an average of Argentina and Indonesia, of Sports and Fashion. Almost no real campaign sits at that intersection. Cost of a no: you shortlist a merely average account and present it internally as a top performer.
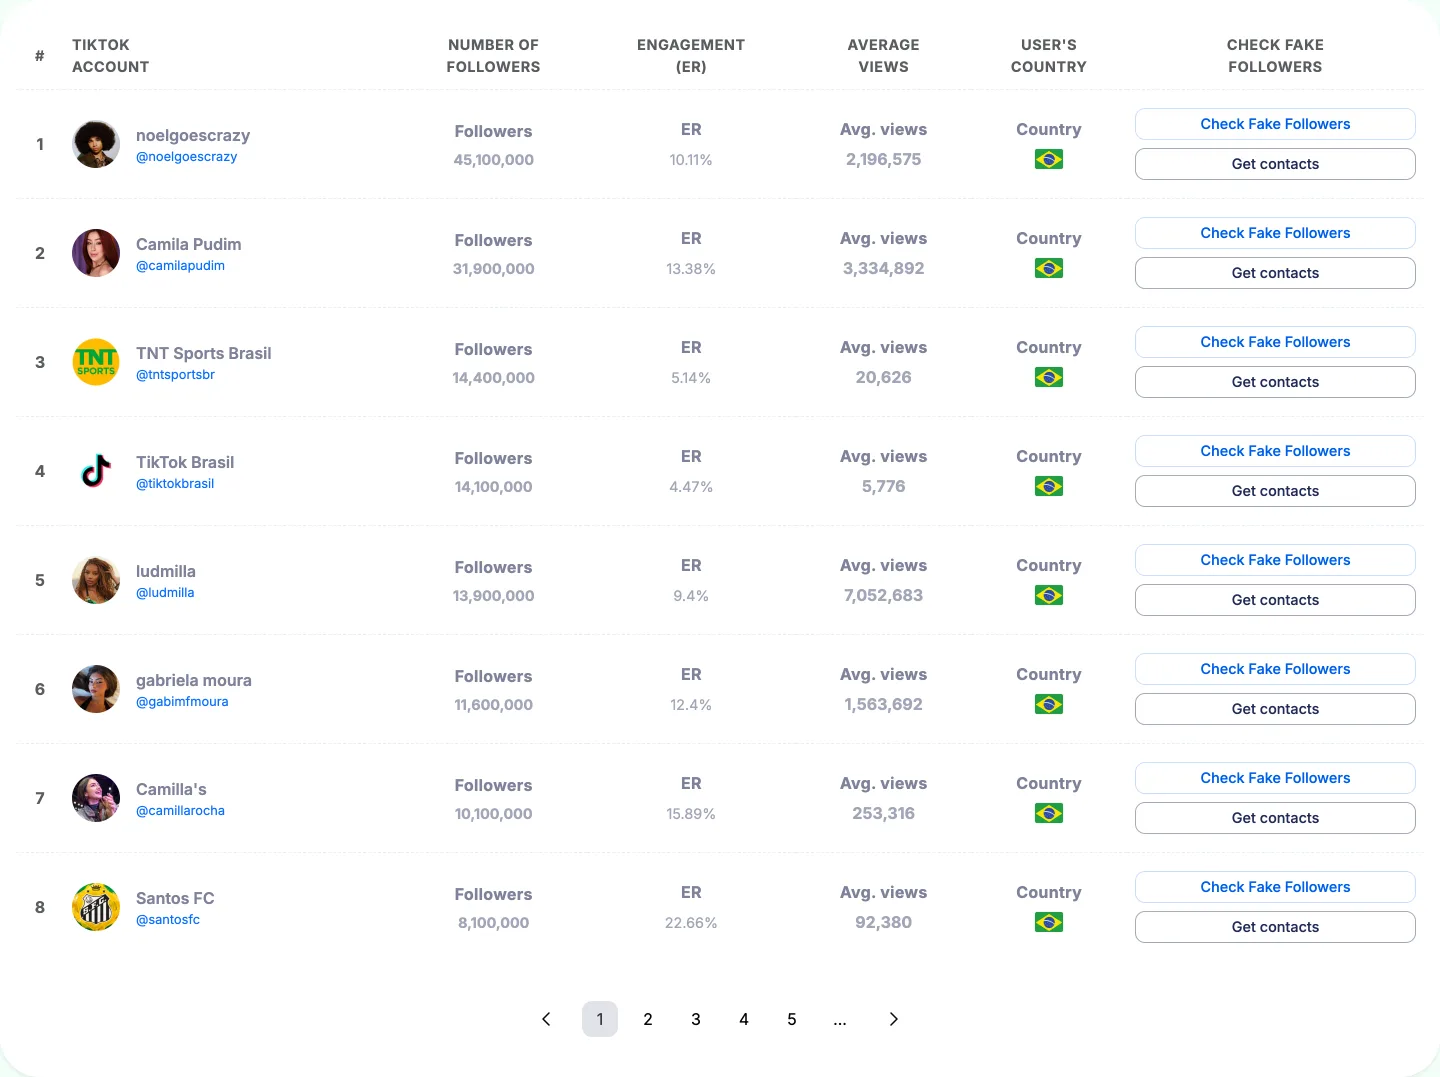
On TikTok, do average views clear a sensible fraction of the sample median, and does views-per-follower approach it? The sample medians 327,058 average views and 17.41% views per follower. Views per follower is the check that tests whether a follower count is actually being served — a 2M-follower account delivering 80,000 views has an audience it no longer reaches. Screen for it in the TikTok creator search alongside engagement, not after it.
Have you checked whether the mean is pulling you off course? Instagram mean engagement in the sample is 1.41% against a 0.51% median. If you calculate your own average across a shortlist, a handful of extreme accounts will inflate it by nearly 3x and you will set a pass mark most of your candidates cannot reach. Use medians.
Is the candidate ranked highly for followers rather than for engagement? Position on a most-followed table says nothing about performance — the entire sample here is drawn that way, which is exactly why the tier data is unusable on Instagram. Rank is a discovery shortcut, not a quality signal. Filter properly in the influencer discovery search instead.
Stage 4 — Verification: the audience behind the rate is real, reachable and in your market
Have you run an audience-composition check before accepting the engagement rate? This is the ordering that most teams get backwards. Engagement rate is calculated over the audience — it is a division, and the denominator is the follower count. If a large share of that count is suspicious, the resulting percentage is arithmetic, not evidence. Run the audience quality audit first, and read the engagement number only once the denominator has survived it.
Have you recalculated the addressable audience from the real-follower share rather than from the headline number? An account with 2.3M followers — the TikTok sample median — and a 60% real share is a 1.4M-follower buy. Price it as one.
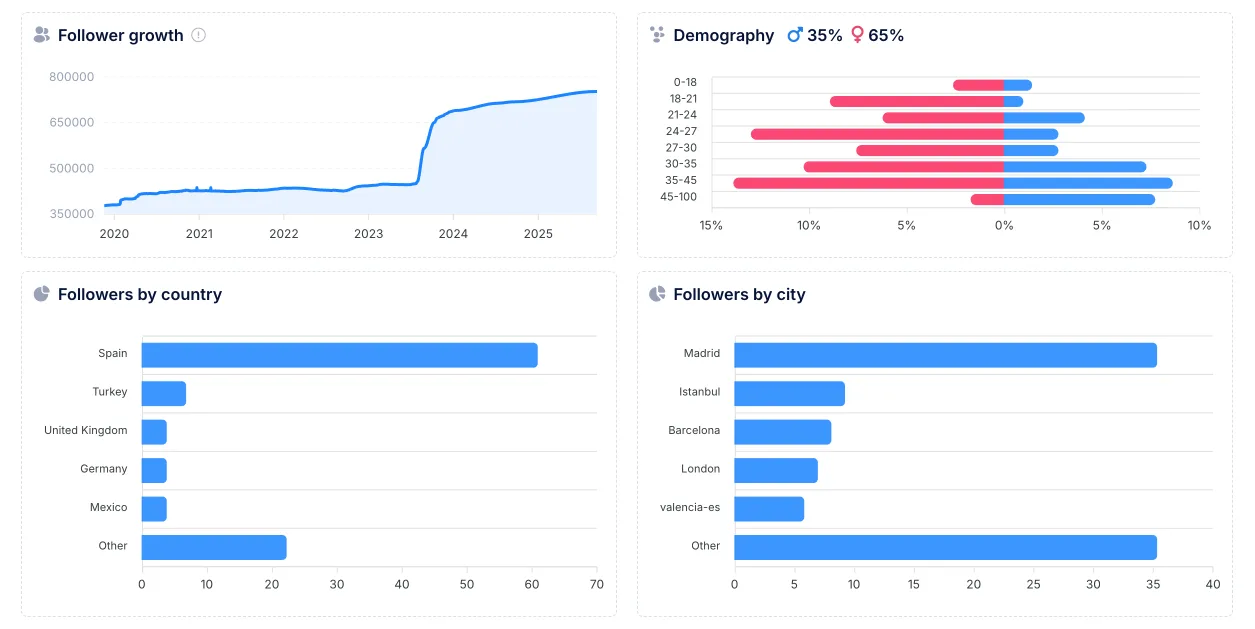
Does the audience's location split match the country you briefed? A creator based in your market can hold most of their followers elsewhere. This is the single most common reason a well-chosen creator produces no measurable sales lift.
Does the follower growth curve look paced rather than spiked? Vertical jumps with no campaign or press event behind them mean an audience that was acquired rather than built. The practical patterns are covered in our guide to detecting fake followers on Instagram and TikTok.
Do the age and gender splits match who you sell to? Reach into people who cannot buy your product is reach you paid for twice — once in fee, once in the reporting line that shows nothing happened.
Stage 5 — Sign-off: the decision is documented well enough to survive the post-campaign review
Have you recorded the benchmark used, the country and category it came from, and the date of the data? The figures in this checklist are dated September 1, 2026. A threshold with no date attached cannot be audited three months later, because nobody can tell whether it was wrong or simply old.
Have you noted which checks the candidate failed and why you approved anyway? An exception you can explain is a decision. An exception with no note is a mistake waiting to be found by someone reviewing an underperforming campaign.
Have you agreed the reporting metric in advance? If you selected on views per follower, do not let the post-campaign review grade you on engagement rate. Fix the column before the contract is signed.
Have you kept the rejected shortlist? Runners-up are the cheapest replacement when a creator drops out two weeks before launch — and they are already benchmarked.
Reading the finished sheet: three failure patterns and what each one means
High rate, weak audience composition. The number is a division over a denominator you do not trust. Walk. This is the one pattern where a strong-looking metric is actively worse than a weak one, because it invites you to skip the check.
On-benchmark rate, mismatched audience country. The creator is fine; the market is wrong. Keep them on file for the campaign where their actual audience geography is the target.
Below benchmark on engagement, strong views per follower on TikTok. That is a reach buy, not an engagement buy. Reprice against views rather than rejecting — but change the reporting metric in Stage 5 to match.
How many checks can a creator fail and still be worth signing?
Count by stage, not by number. Failures in Stages 1 and 2 are yours, not the creator's, and they invalidate everything below — a shortlist built without a country or a benchmark has to be rebuilt. A Stage 4 audience-composition failure is fatal regardless of how the other stages scored. A Stage 3 miss is negotiable: below-median engagement with strong views is a pricing conversation, not a rejection.
What engagement rate counts as good on Instagram?
It depends on where and in what. The overall median in this sample is 0.51%, but country medians run from 1.72% in Argentina to 0.07% in Indonesia, and category medians from 1.04% in Sports to 0.23% in Fashion. Build the pass mark at the intersection of your country and category. And remember the caveat: these figures describe the 700 most-followed accounts across 14 countries as of September 1, 2026, so they characterise the largest accounts only.
Why is TikTok engagement so much higher than Instagram engagement?
The medians are 9.05% against 0.51% — but part of that gap is sample construction, not platform behaviour. The Instagram sample is 100% 1M+ accounts; the TikTok sample is 63.1%, with the rest spread across smaller tiers that engage differently. Treat the two as separate scales with separate pass marks, not as a ranking that says one platform outperforms the other.
Should I use follower count as a quality filter?
On TikTok you have grounds for it: 10.45% median at 1M+ against 6.79% at 100K–1M in this sample. On Instagram you have none — every sampled account is 1M+, so there is nothing to compare. Use size as a reach input that tells you how many people you can reach, and use engagement and audience quality to tell you whether reaching them is worth anything.
What do I check first: engagement or audience quality?
Audience quality, always, because engagement is computed over the audience. A high rate on a heavily suspicious follower base is not a strong candidate — it is an unmeasured one. You do not know what the number means until you know what the denominator contains.
Can I reuse the same checklist for a different country?
Yes for the items, no for the numbers. The five stages and every yes/no question transfer unchanged. The pass marks in Stages 2 and 3 do not: re-pull them per country and per platform, because Turkey at 0.9% on Instagram and 5.99% on TikTok is the same market with two entirely different bars.
How current do these benchmarks need to be?
These figures are dated September 1, 2026. Re-pull them per campaign rather than storing one number in a template and reusing it for a year — engagement rates move, and a stale threshold fails good creators quietly. Recording the date alongside the threshold is a Stage 5 item precisely because that is what makes the decision auditable later.
Frequently asked questions
What's the difference between Instagram and TikTok engagement rates?
In this sample of 1,337 accounts, Instagram median engagement is 0.51% while TikTok median is 9.05%. Part of that gap reflects sample construction: the Instagram sample is 100% 1M+ accounts, while the TikTok sample is 63.1% 1M+ with the rest across smaller tiers. Treat them as separate scales with separate pass marks.
How do engagement benchmarks vary by country?
On Instagram, country medians in this sample range from 1.72% in Argentina to 0.07% in Indonesia. On TikTok, they range from 13.94% in Mexico to 3.91% in Indonesia. If you run Argentina and Germany (0.22% on Instagram) off the same engagement sheet, you will sign every Argentine creator and none of the German ones.
How do engagement benchmarks vary by category?
On Instagram, category medians run from 1.04% in Sports down to 0.23% in Fashion—a factor of 4.5x. A 0.6% engagement rate is a comfortable pass in Fashion but a clear fail in Sports. Categories on Instagram include Sports, Rugby, Football & Soccer, Entertainment, Fashion Trends, and Fashion.
What should I check on TikTok beyond engagement rate?
Screen for average views and views per follower. The sample medians 327,058 average views and 17.41% views per follower. Views per follower tests whether a follower count is actually being served—a 2M-follower account with only 80,000 views has an audience it no longer reaches.
Can I use follower count as a quality filter?
On TikTok yes: the sample shows 10.45% median engagement at 1M+ versus 6.79% at 100K–1M. On Instagram no—all 700 sampled accounts are 1M+, so there is nothing to compare. Use size as a reach input and engagement and audience quality to determine if reaching them is worth anything.
Should I check audience quality before or after engagement rate?
Always before. Engagement is calculated over the follower count, so if a large share of that audience is suspicious, the resulting percentage is arithmetic, not evidence. Run the audience quality audit first and read the engagement number only once the denominator has survived it.
What happens if a creator fails an audience composition check?
A Stage 4 audience-composition failure is fatal regardless of how the other stages scored. A high engagement rate on a heavily suspicious follower base is not a strong candidate—it is an unmeasured one because you do not know what the number means until you know what the denominator contains.